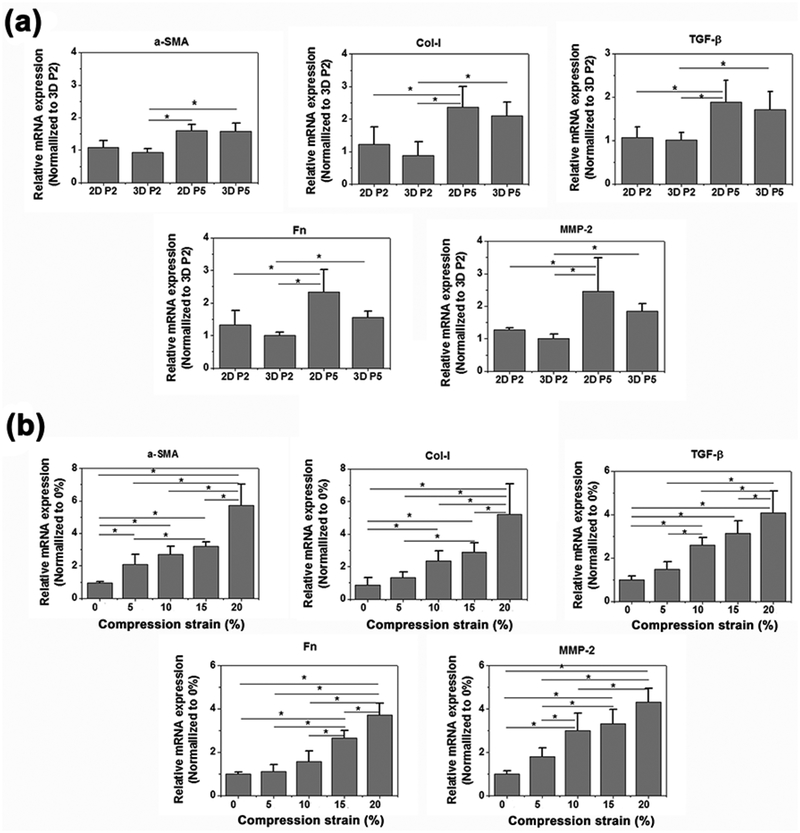
Figure 4.
RT-PCR of relative mRNA expression of α-SMA, Col-I, TGF-β, Fn and MMP-2 of (a) CFs of P2 or P5 which were cultured on 2D TCPS cell plate or in 3D hydrogels in microdevices; (b) CFs of P2 cultured in 3D GelMA hydrogels after 7 days cyclic compression stimulation of different strain from 0 to 20% (n=4). Data depicts fold-change ± standard deviation. *p<0.05.

