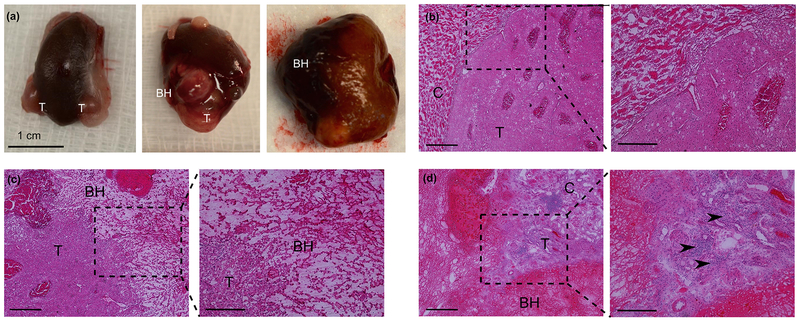
Figure 3.
(a) Gross view of RCC (T) from sham (left) and BH-treated subjects at 1 hour (center) and 48 hours (right) time points. (b) Representative histological appearance of a sham-treated renal tumor (T) and adjacent kidney cortex (C). (c) Histological appearance of the BH-treated tumor at 1 hour time point reveals a sharp boundary between homogenized (BH) and intact tumor (T). (d) Histological appearance of BH-treated tumor at 48 hour time point. Acute inflammatory infiltrate is apparent on higher magnification (inset, arrowheads).

