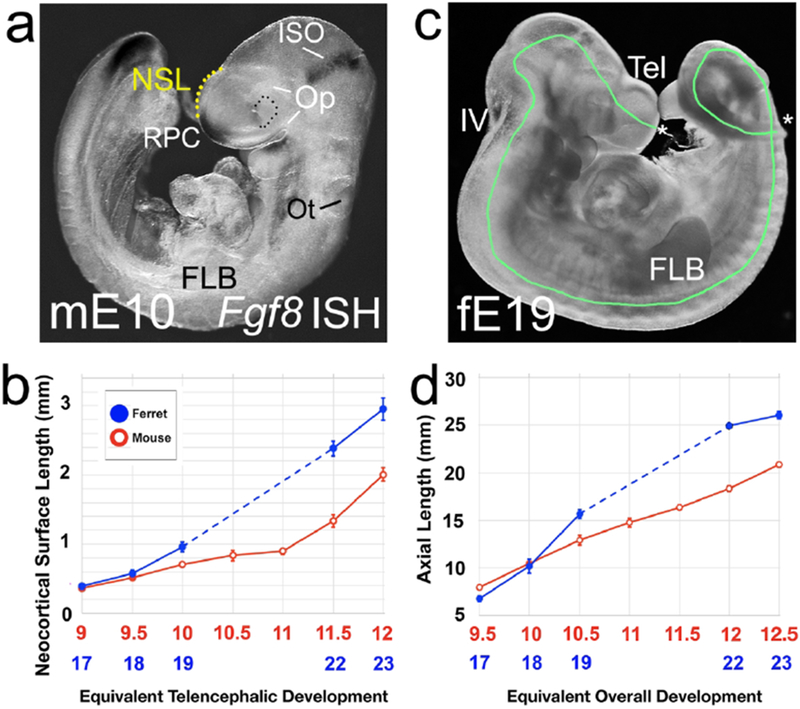
Figure 11. Size of the ferret NP is similar to mouse at a critical period for morphogen patterning.

(a) Mouse E10 embryo, lateral view. Fgf8 expression is marked by ISH (black patches at the RPC, isthmus). Broken yellow line shows the NSL measurement. (c) Ferret E19 embryo, lateral view. Green line indicates the axial length (AL) measurement. Asterisks indicate the rostral tip of the telencephalon and the caudal tip of the tail, the two endpoints of the AL. (a, c) are not to scale. (c) The NSL measurement is the same in mouse and ferret at the two earliest ages, and then begins to diverge (d) Overall growth of the body shows s similar “hold then diverge” pattern. Broken lines in (b,d) indicate missing ferret ages and not NSL or AS.
