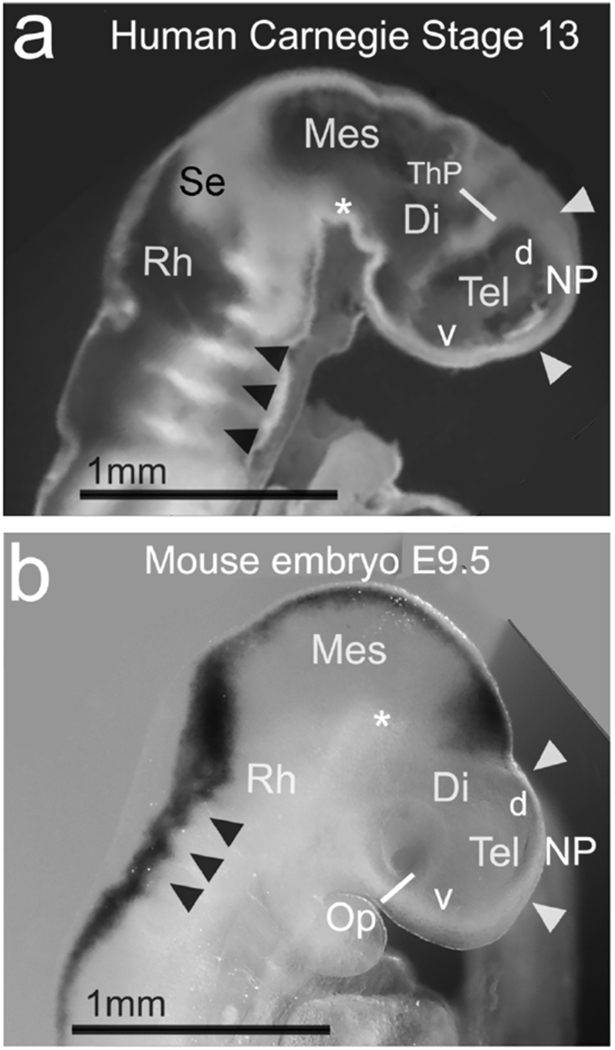
Figure 12. R/C length of the NP appears similar in CS13 human and E9.5 mouse.

(a,b) A human and mouse embryo compared. The human embryo image in (a) is adapted from an image of a midline sagittal section through a CS13 human embryo, shown in movie 7.11 (Hill et al., 2016), and online (Hill, M.A., 2018, September 24, Embryology Stage 13 EFIC Movie 1.) Labeling is by the authors of the present study. The mouse embryo in lateral view in (b) is cropped from Figure 1b above, rotated, and enlarged to the same scale as in (a). (a,b) White arrowheads indicate our estimate of the rostral and caudal NP boundaries in each specimen. The two NPs appear comparable in size. Black arrowheads indicate rhombomeres, and white asterisks indicate the cephalic flexure in (a,b). Abbreviations: d, dorsal (telencephalon); Rh, rhombencephalon; ThP, thalamic primordium; v, ventral (telencephalon).
