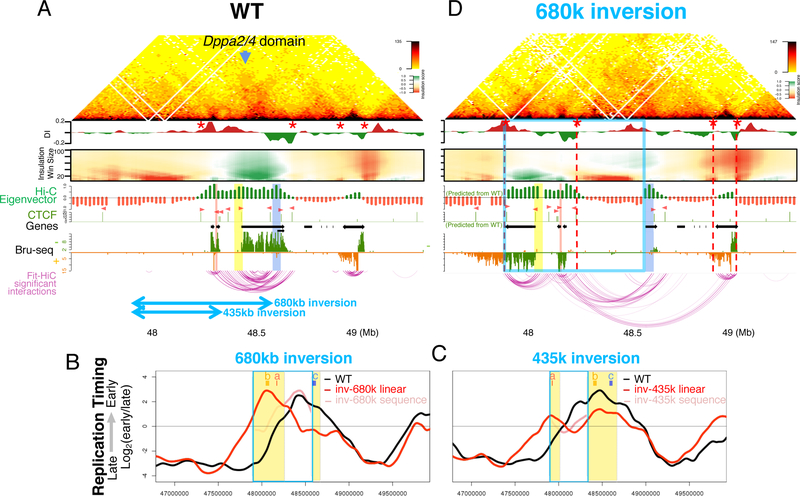
Figure 5. ERCE-containing inversions.
A. WT capture Hi-C heatmap, DI and domainograms as in Figure 3, showing positions of inversions (bottom blue arrows), sites a, b and c (red, yellow and blue, respectively), and TAD boundaries (red stars).
B,C. RT profile for the 680kb (B) and 435kb (D) inversions with WT (black) and inverted (red) alleles and inverted allele with WT coordinates (pink).
D. Capture Hi-C of the 680kb inversion with linear distance after inversion, indicating the inverted region (blue box) and newly formed boundaries (red stars and red dashed lines). Eigenvector and CTCF ChIP-seq peaks (pink arrowheads indicate orientation) are inverted from WT data.

