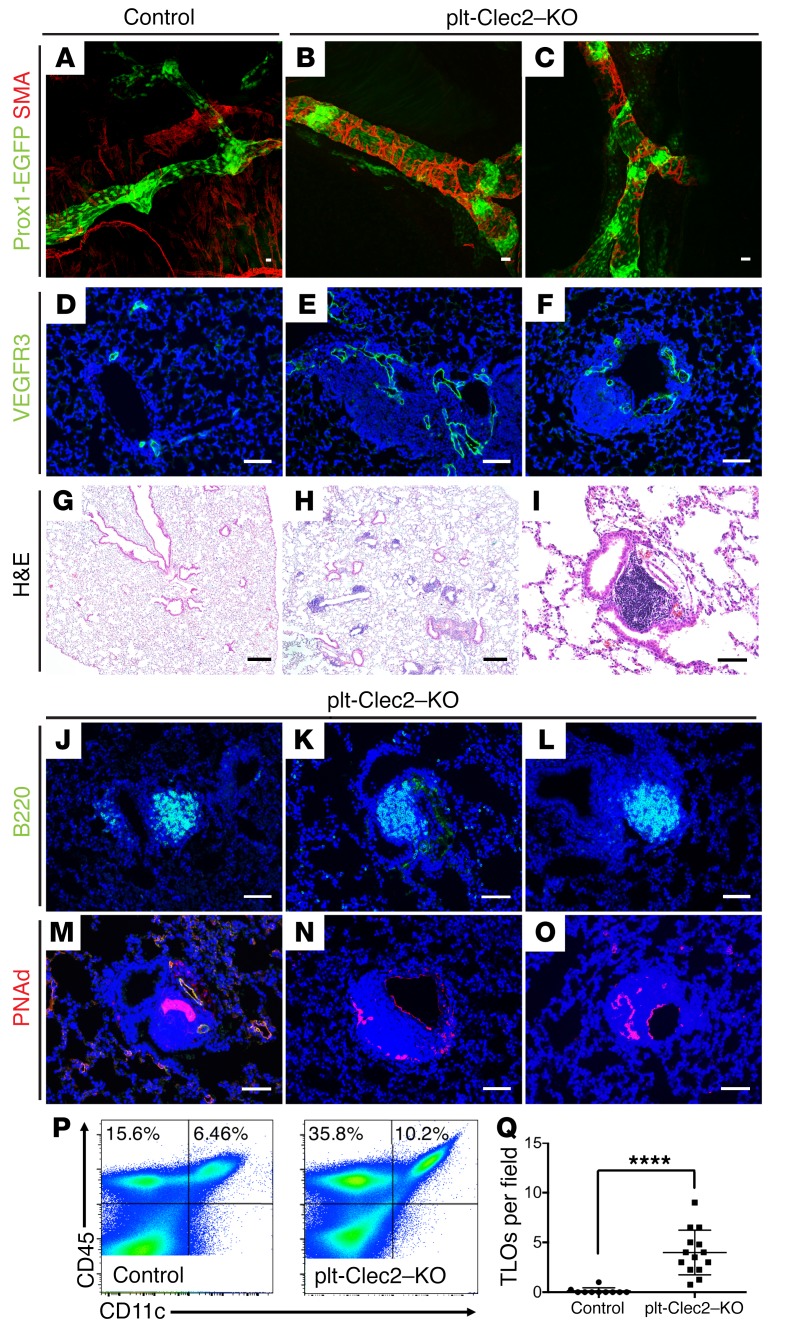
Figure 4. Platelet-specific loss of CLEC2 results in abnormal pulmonary lymphatic morphology and TLO formation in the lung parenchyma.
(A–C) Whole-mount SMA staining (red) of pulmonary lymphatic vessels (Prox1-EGFP, green) from 6- to 8-week-old plt-Clec2–KO and control mice. (D–F) Immunohistochemical analysis of lung tissue sections stained for VEGFR3 (green) shows lymphatic vessels of 6- to 8-week-old plt-Clec2–KO and control mice. (G–I) H&E-stained images of lung tissue from 8- to 12-week-old plt-Clec2–KO and control mice. (J–O) Immunohistochemical analysis of B cells (B220, green) and HEVs (PNAd, red) from plt-Clec2–KO and control mice. (P) Flow cytometric analysis of CD45+CD11c+ cells in lung tissue from control and plt-Clec2–KO mice. (Q) Quantification of TLOs in the lungs of 8- to 12-week-old plt-Clec2–KO mice compared with control littermates per ×4 (1.1 × 1.3 mm) microscopic field. Data are representative of at least 5 mice in each group. Scale bars: 25 μm (A–F and I–O) and 100 μm (G and H). All values represent the mean ± SEM. **** P < 0.0001, by Student’s t test.

