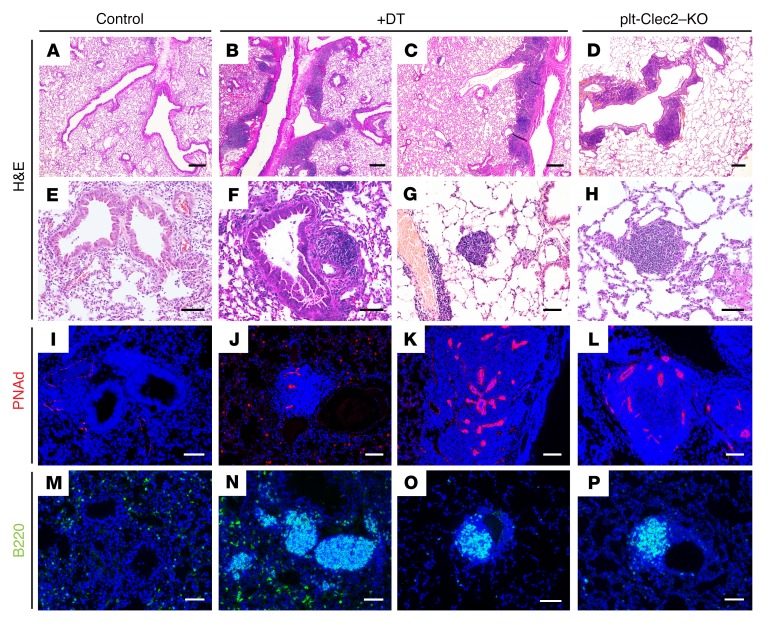
Figure 7. TLOs after lung lymphatic ablation resemble those in plt-Clec2–KO mice.
(A–H) H&E-stained images of lung tissue from control transplanted lungs, DT-treated iDTR VEGFR3CreERT2 transplanted lungs with lymphatic ablation, and lungs from plt-Clec2–KO mice. (I–P) Immunohistochemical analysis of B cells (B220, green) and HEVs (PNAd, red) in control transplanted lungs, DT-treated iDTR VEGFR3CreERT2 transplanted lungs, and plt-Clec2–KO lungs. Data are representative of 4 mice in each group. Scale bars: 100 μm (A–D) and 25 μm (E–P).

