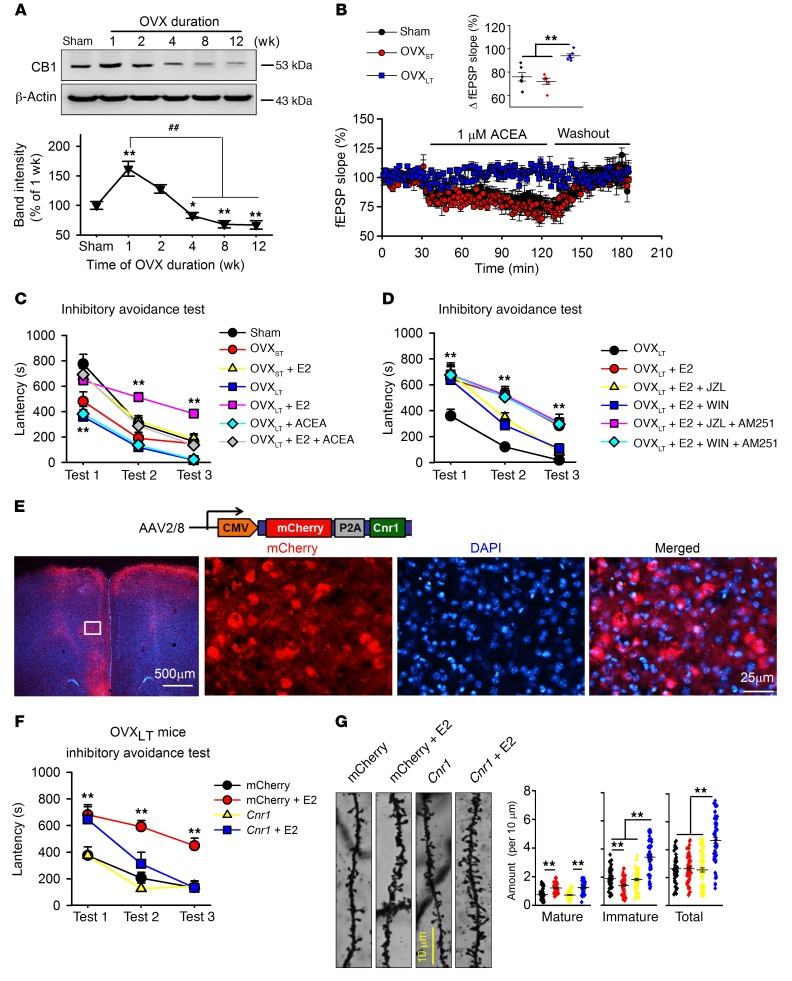
Figure 3. Decreased CB1 in mPFC and rescue of impairment of memory extinction by activation of CB1 in E2-treated OVXLT mice.
(A) Levels of CB1 in mPFCs of mice after OVX. n = 6 mice per group; 1-way ANOVA followed by Bonferroni’s post hoc test; *P < 0.05 and **P < 0.01 vs. sham group, ##P < 0.01 vs. mice 1 week after OVX. (B) Synaptic fEPSP response to ACEA (CB1 agonist, 1 μM) perfusion in mPFC slices from different mice. Inset shows the averaged fEPSP slope from 90 to 120 minutes. n = 8 slices from 4 mice per group. **P < 0.01 between the marked groups by 1-way ANOVA followed by Bonferroni’s post hoc test. (C) Effects of ACEA (0.5 mg/kg, s.c.) combined with E2 (0.1 mg/kg, s.c.) on fear memory formation and extinction. (D) Effects of JZL184 (2-AG hydrolysis enzyme inhibitor, 8 mg/kg, s.c.) or WIN55,212-2 (nonselective cannabinoid receptor agonist, 1 mg/kg, s.c.) combined with E2 on fear memory formation and extinction, and blockage of AM251 (CB1-specific antagonist, 3 mg/kg, s.c.). (C and D) n = 8 mice per group. **P < 0.01 vs. sham or OVXLT mice by univariate ANOVA after lower-bound correction as repeated-measurement data. (E) Images showing AAV-CMV-mCherry-Cnr1 injection in mPFC of OVXLT mice. (F) Inhibitory avoidance test was carried out 4 weeks after AAV injection. n = 8 mice per group. **P < 0.01 vs. mCherry by univariate ANOVA after lower-bound correction as repeated-measurement data. (G) Representative images of basilar dendrites from mPFC neurons. Number of total and different spine subtypes. n = 60 neurons from 6 mice per group. **P < 0.01 between the marked groups by 2-way ANOVA followed by Bonferroni’s post hoc test. Experimenters were blinded to the treatment. Data are represented as mean ± SEM.

