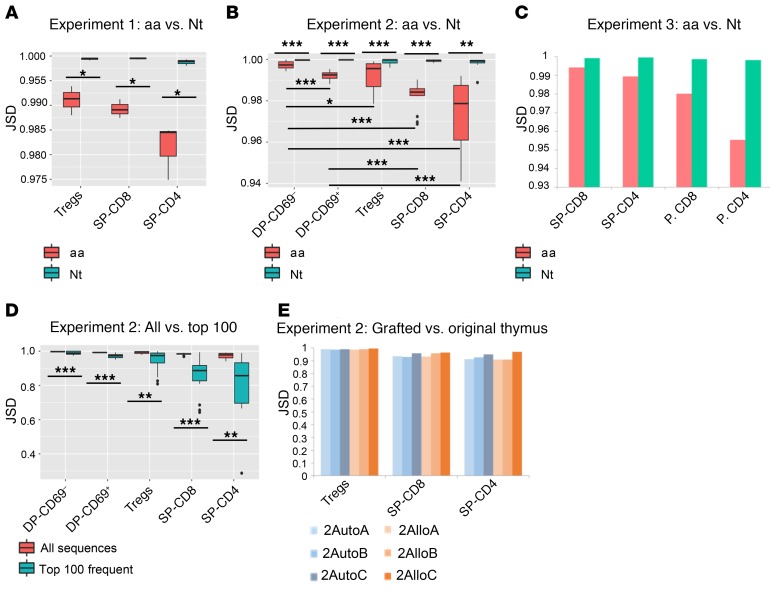
Figure 2. Repertoire divergence between animals in each experiment.
(A–C) JSD scores at nucleotide and aa levels for each cell population in experiment 1 (n = 3 comparisons), experiment 2 (n = 15 comparisons), and experiment 3 (n = 1 comparison), respectively. JSD scores for each possible pair of mice were calculated and are presented as box-and-whisker plots, which show the median, range, and interquartile range, as well as outliers (except experiment 3, for which only 1 comparison per cell subset is shown, because there were only 2 mice). (D) JSD aa scores across different cell populations in experiment 2 for all sequences versus the 100 most frequent sequences. (E) JSD aa scores for TCR repertoires of different cell populations from grafted thymi of the 6 mice in experiment 2 compared with the original autologous fetal thymus. *P < 0.05, **P < 0.01, and ***P < 0.001, by paired t test with Bonferroni’s multiple testing correction for all comparisons.

