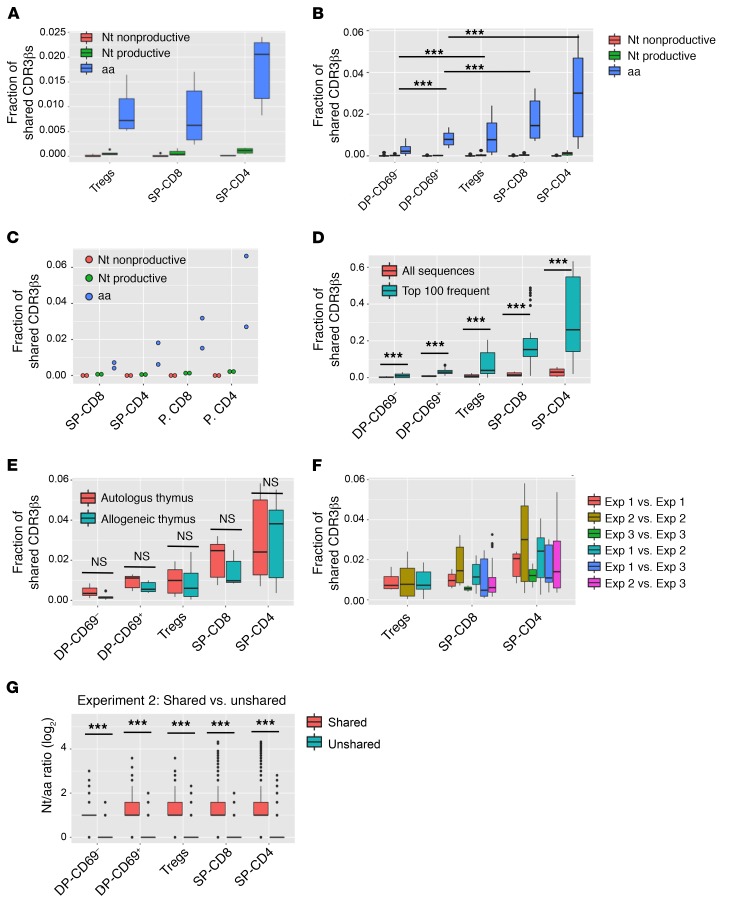
Figure 3. Proportion of shared CDR3βs between animals and experiments.
(A–C) Box-and-whisker plots (dot plot for experiment 3 because of the smaller sample size) comparing proportions of shared CDR3βs between each asymmetric mouse pair in experiment 1 (n = 6 comparisons), experiment 2 (n = 30 comparisons), and experiment 3 (n = 2 comparisons) for each cell population at the nucleotide nonproductive, nucleotide productive, and aa levels. (D) Box-and-whisker plot distributions of the proportion of shared CDR3βs comparing all versus the top 100 sequences by frequency in experiment 2. (E) Comparisons in both directions between each pair of mice in experiment 2, depending on whether the mice received the same (autologous thymus, n = 12 comparisons) or a different thymus (allogeneic thymus, n = 18 comparisons). (F) Distributions of the proportion of shared CDR3βs between each pair of mice within and across experiments. Exp, experiment. (G) Ratio of unique CDR3β nucleotide sequences per aa sequence (Nt/aa ratio) in shared versus unshared sequences for each pair of mice in experiment 2. Supplemental Table 5 shows the mean Nt/aa ratio for each subset and P values comparing different subsets. Box-and-whisker plots show the median, range, interquartile range, and outliers. ***P < 0.001, by paired t test with Bonferroni’s multiple testing correction.

