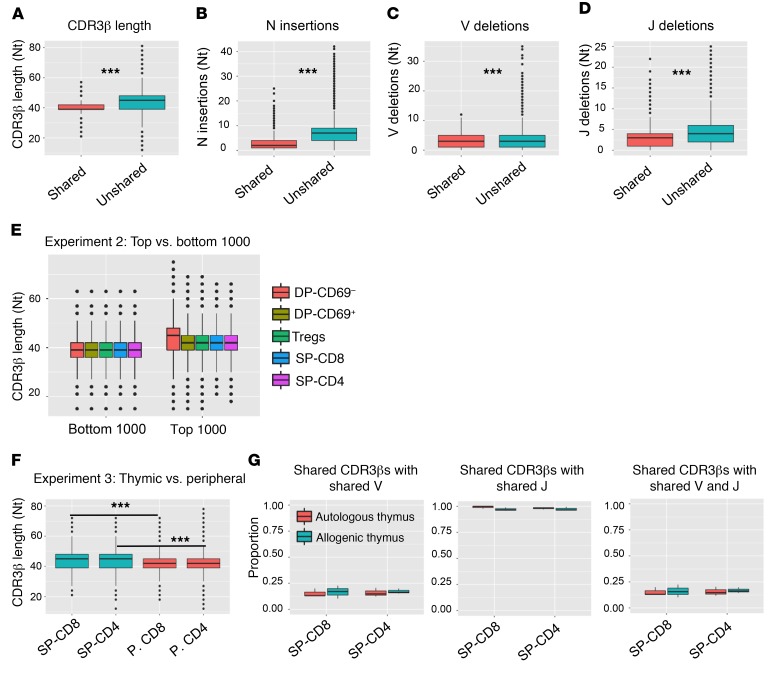
Figure 4. Characteristics of shared versus unshared CDR3βs.
(A) Nucleotide length distribution of shared versus unshared SP-CD4 CDR3βs in experiment 2. (B) Number of nontemplate nucleotide insertions at V-D plus D-J junctions for shared versus unshared SP-CD4 CDR3βs. (C and D) Number of nucleotides that are deleted from the 3′ end of V genes and the 5′ end of J genes at V-D and D-J junctions of SP-CD4 CDR3βs, respectively. (E) Distribution of combined (all 6 mice in experiment 2) CDR3β length for the 1000 most frequent CDR3βs and the 1000 CDR3βs with the lowest frequencies across different thymic cell populations. The Supplemental Table 6 shows P values comparing different cell subsets (unpaired t test). (F) Nucleotide CDR3β length for all thymic and peripheral T cell subsets in experiment 3. (G) Proportion of shared CDR3βs (aa level) using the same Vβ gene, Jβ gene, and Vβ-Jβ pair for SP-CD4 and SP-CD8 T cell populations, comparing mice with the same (autologous) versus allogeneic thymus in experiment 2. ***P < 0.001, by paired t test with Bonferroni’s multiple testing correction. Box-and-whisker plots show the median, range, interquartile range, and outliers.

