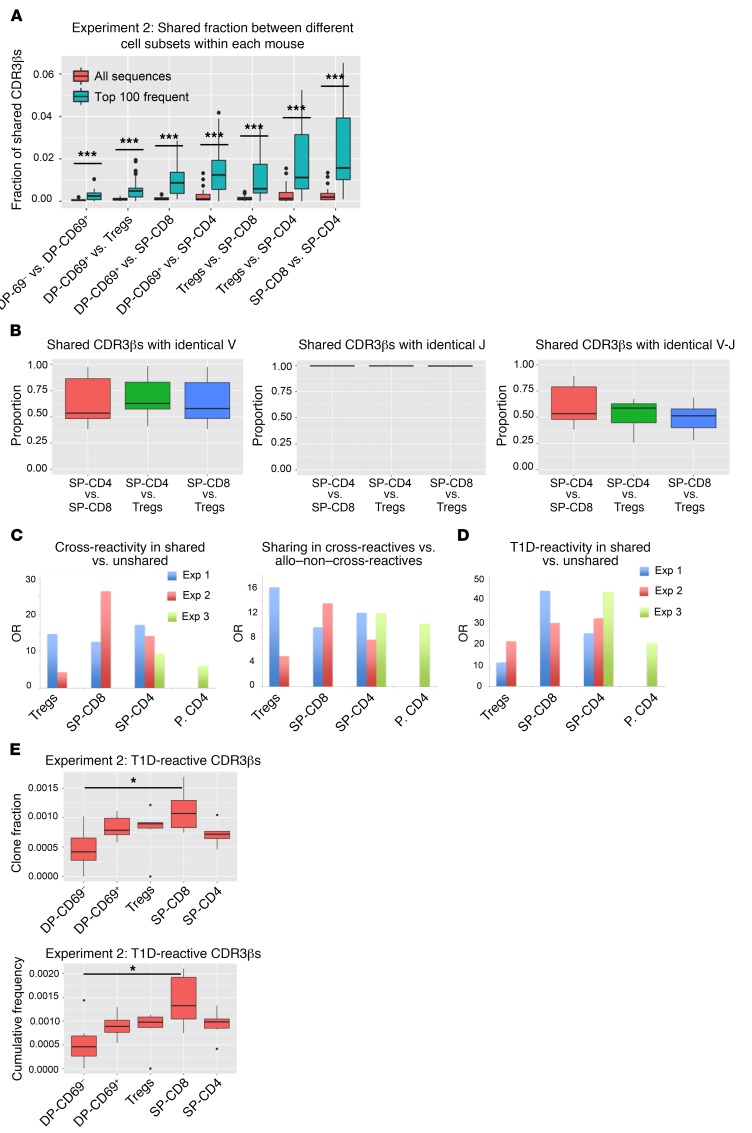
Figure 5. Overlap between different cell subsets and enrichment for cross-reactive/autoreactive CDR3βs among shared sequences.
(A) Proportions of shared CDR3βs between paired cell populations in each thymus graft in experiment 2 (aa level) among all versus the 100 most frequent CDR3βs (n = 6). Potentially ambiguous sequences present in more than 1 cell population were not removed from this analysis. Supplemental Table 11 shows the average number of unique nucleotide sequences per aa sequence for shared versus unshared CDR3βs between SP-CD4 and SP-CD8 cells. (B) Proportion of shared CDR3βs with a shared Vβ gene, Jβ gene, and Vβ-Jβ pair, comparing each pair of SP cell populations in each mouse in experiment 2. (C and D) ORs of cross-reactivity in shared versus unshared sequences, sharing in cross-reactive versus allo–non–cross-reactive sequences, and T1D reactivity in shared versus unshared sequences for experiments 1, 2, and 3. P values are shown in Supplemental Table 12. (E) Clone fraction and cumulative frequency of T1D-reactive CDR3βs in different cell subsets in experiment 2. *P < 0.05 and ***P < 0.001, by unpaired t test with Bonferroni’s correction (A) and paired t test with Bonferroni’s correction (paired by mouse) (E). Box-and-whisker plots show the median, range, interquartile range, and outliers.

