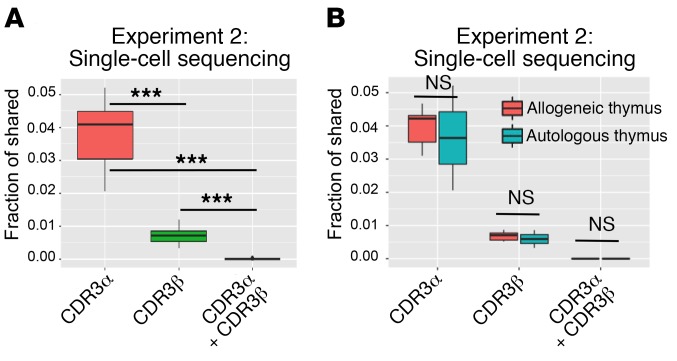
Figure 6. Fraction of shared CDR3αs, CDR3βs, and paired CDR3α-CDR3βs revealed by single-cell T cell sequencing.
(A) Fraction of shared CDR3αs, CDR3βs, and paired CDR3α-CDR3βs for SP-CD4 cells between each pair of mice in experiment 2 (except 2autoA mice) at the aa level (comparisons in both directions, n = 20 comparisons). ***P < 0.001, by unpaired t test. (B) Comparisons in both directions between each pair of mice, depending on whether the mice received the same (autologous thymus, n = 8 comparisons) or a different thymus (allogeneic thymus, n = 12 comparisons).

