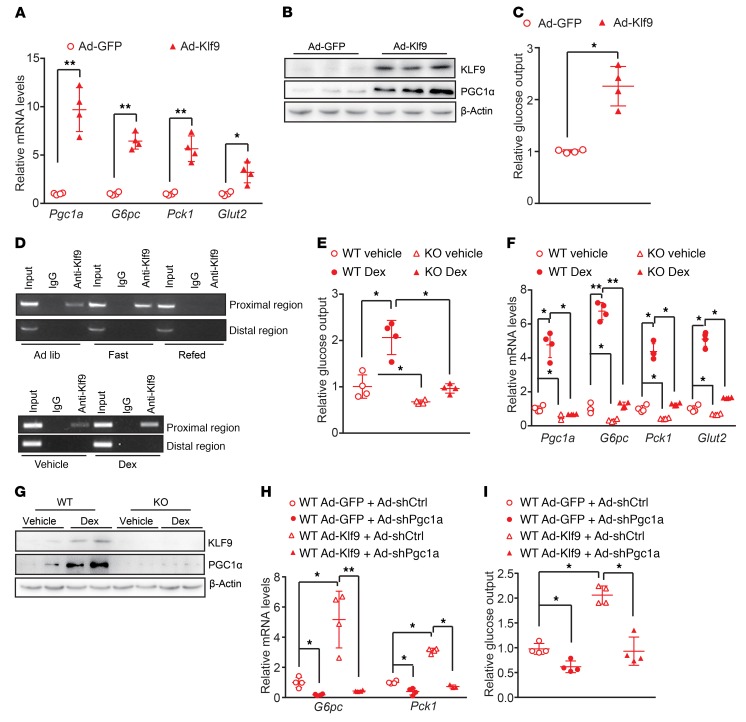
Figure 2. KLF9 activates the gluconeogenic program in primary hepatocytes through PGC1α.
(A) Quantitative PCR analysis showing mRNA levels of Pgc1a, G6pc, Pck1, and Glut2 in mouse primary hepatocytes infected with Ad-GFP or Ad-Klf9. Cells were harvested for further analysis 48 hours after infection. (B) Western blot analysis of KLF9 and PGC1α in primary hepatocytes treated as described in A. (C) Glucose output assay showing the effects of Klf9 overexpression on glucose production in primary hepatocytes as described in A. (D) ChIP assay performed as described in Methods, showing that both fasting (top panel) and Dex treatment (bottom panel) promote endogenous KLF9 binding to the proximal region of the Pgc1a gene promoter, but not the distal region (as a negative control). (E) Glucose output assay showing glucose production in primary hepatocytes isolated from global Klf9-mutant and WT C57BL/6 mice treated with Dex (100 nM) or saline for 12 hours. (F) Quantitative PCR analysis (left) of Pgc1a, G6pc, Pck1, and Glut2 in the primary hepatocytes described in E. (G) Representative Western blot analysis of hepatic KLF9 and PGC1α in the primary hepatocytes described in E. (H) Quantitative PCR analysis of G6pc and Pck1 in primary hepatocytes infected with the indicated adenoviruses. (I) Glucose output assay showing glucose production in the primary hepatocytes described in H. Data are represented as mean ± SEM. *P < 0.05; **P < 0.01, 2-tailed Student’s t test (A, C), 2-way ANOVA (E, F), or 1-way ANOVA (H, I).

