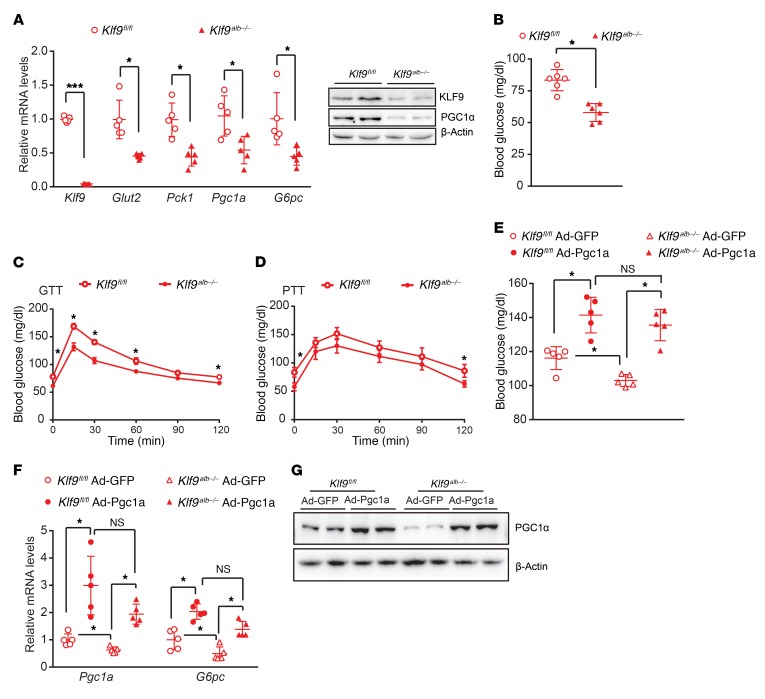
Figure 4. Liver-specific Klf9-deficient mice display decreased fasting blood glucose and enhanced glucose tolerance.
(A) Quantitative PCR (left panel) and Western blot (right panel) of Klf9 and other gluconeogenic genes/proteins in the livers of 6 hour–fasted Klf9alb–/– mice and control littermates (Klf9fl/fl) at 8 to 9 weeks of age (n = 5/group). (B) Blood glucose in 6 hour–fasted Klf9fl/fl mice or Klf9alb–/– mice (n = 8/group). (C, D) Blood glucose during GTT (C) and PTT (D) of Klf9fl/fl mice or Klf9alb–/– mice (n = 6/group). (E) Blood glucose in 6 hour–fasted Klf9fl/fl mice and Klf9alb–/– mice injected with Ad-GFP or Ad-Pgc1a (n = 5/group). (F) Quantitative PCR analysis of hepatic Pgc1a and G6pc mRNA levels in mice treated as in E (n = 5/group). (G) Representative Western blot analysis of hepatic PGC1α protein levels in mice treated as in E. Data are represented as mean ± SEM. *P < 0.05; ***P < 0.001, 2-tailed Student’s t test (A-D) or 2-way ANOVA (E, F).

