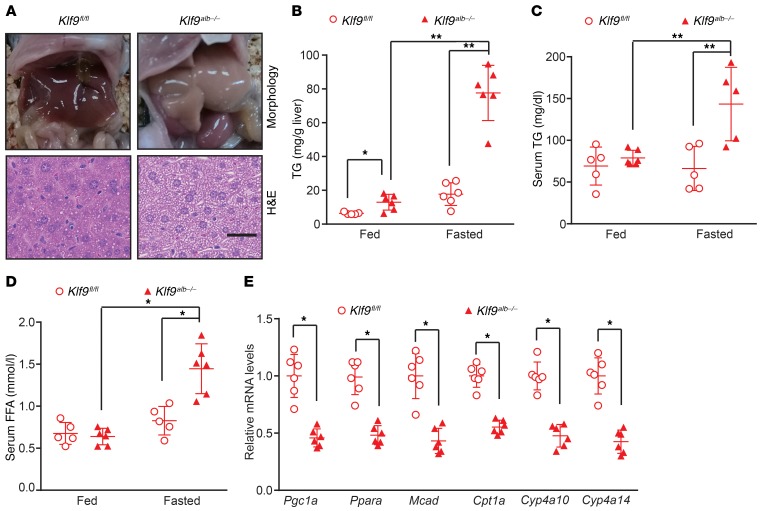
Figure 5. Liver-specific Klf9-deficient mice display fasting-induced hepatic steatosis.
(A) Representative gross morphology and H&E staining of livers from Klf9fl/fl mice and Klf9alb–/– mice fasted for 24 hours. (B–D) Biochemical analysis showing hepatic TG (B), serum TG (C), and FFA (D) content in ad libitum–fed or 24 hour–fasted Klf9fl/fl mice and Klf9alb–/– mice (n = 5/group). (E) Quantitative PCR analysis of Pgc1a, Ppara, Mcad, Cpt1a, Cyp4a10 and Cyp4a14 in the livers of 24 hour–fasted Klf9fl/fl mice and Klf9alb–/– mice (n = 5/group). Scale bars: 20 μm. Data are represented as mean ± SEM. *P < 0.05; **P < 0.01, 1-way ANOVA (B-D) or 2-tailed Student’s t test (E).

