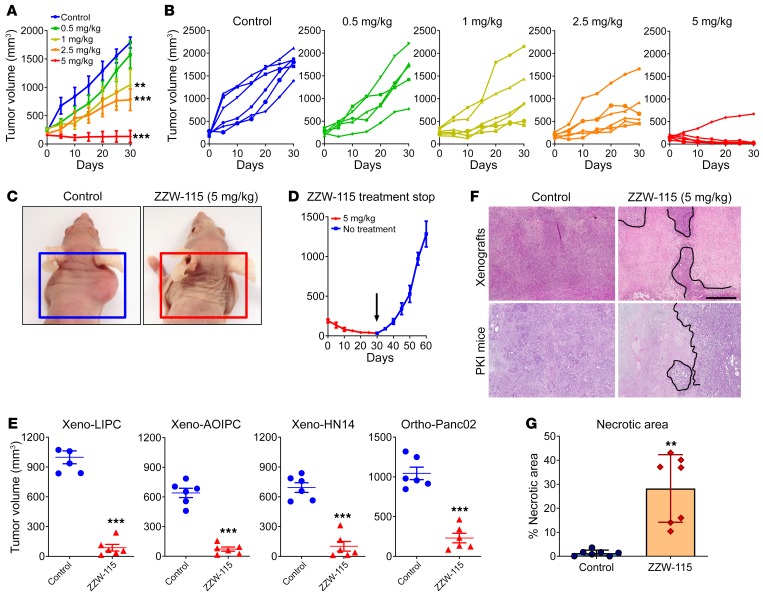
Figure 3. ZZW-115 has strong antitumoral effect in vivo.
NMRI-Foxn1nu/Foxn1nu mice (nude mice) xenografted with MiaPaCa-2 cells were separated into 5 groups of 6 mice and treated daily for 30 days with 0.5% DMSO in physiologic serum (control group) or 5, 2.5, 1.0, or 0.5 mg/kg ZZW-115 compound. Tumor volume was measured every 5 days. Mean of the volume of each treatment (A) and individual volume of each mouse (B) are shown. For each treatment, statistical significance is **P < 0.01 and ***P < 0.001 (1-way ANOVA, Tukey’s post hoc test). (C) Representative pictures of mice from control and 5 mg/kg ZZW-115 treatment groups. (D) Tumor volume of 5 mice treated with 5 mg/kg ZZW-115 measured after an additional 30 days without treatment; the arrow indicates the day the treatment was stopped. Student’s 2-tailed unpaired t test. (E) Tumor volume of nude mice xenografted with PDAC cells or C57BL/6 mice orthotopically implanted with Panc02 cells, and treated with 5 mg/kg ZZW-115 or vehicle. Tumor volume after 30 days of treatment (n = 6). (F) Representative pictures of histologic sections of the tumor xenografts or tumors from PDX1-Cre KrasG12D Ink4afl/fl, PKI mice (both from control or 5 mg/kg ZZW-115–treated mice). Scale bar: 500 μm. (G) Necrotic area in PKI mice, calculated for n = 9 mice. For each treatment, statistical significance is **P < 0.01 and ***P < 0.001 (Student’s 2-tailed unpaired t test).

