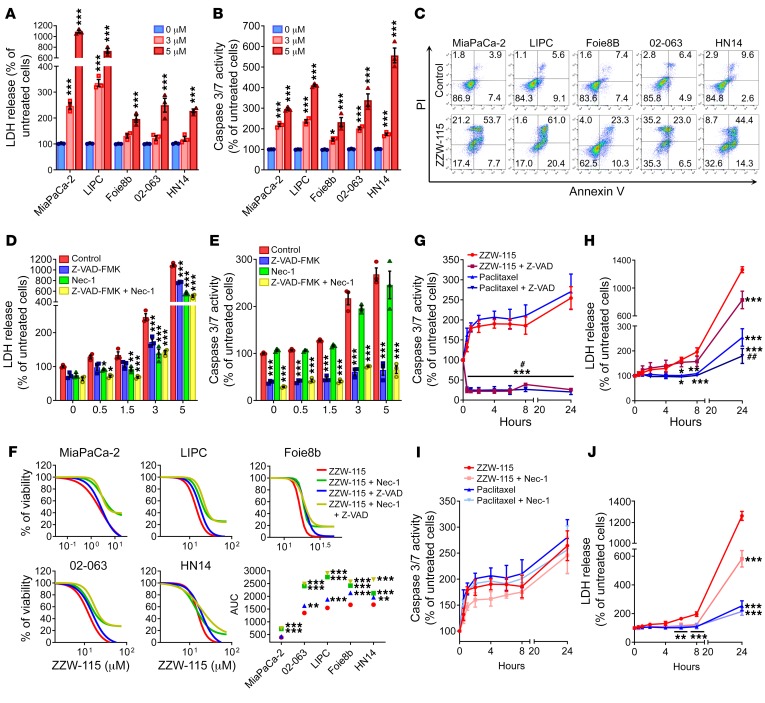
Figure 4. ZZW-115 induces cell death by necrosis and apoptosis in vitro.
A panel of pancreatic cancer cell lines was incubated using 3 or 5 μM ZZW-115 for 24 hours and (A) LDH release and (B) caspase 3/7 activity were measured. Statistical significance is *P < 0.05 and ***P < 0.001 compared with untreated group (2-way ANOVA, Bonferroni’s post hoc test). (C) Flow cytometry analysis of annexin V/PI staining following 24 hours of treatment with 5 μM ZZW-115. A representative experiment of the dot plot profile of cells is shown (n = 3). MiaPaCa-2 cells were incubated from 0.5–5 μM ZZW-115 in the presence or absence of Z-VAD-FMK (20 μM) or/and Nec-1 (40 μM) for 24 hours, and (D) LDH release and (E) caspase 3/7 activity were measured. Statistical significance is *P < 0.05, **P < 0.01, and ***P < 0.001 compared with control group (2-way ANOVA, Bonferroni’s post hoc test). (F) Chemogram assays were done on pancreatic cancer cell lines with increasing concentrations of ZZW-115 in the presence or absence of Z-VAD-FMK (20 μM) or/and Nec-1 (40 μM) for 24 hours. AUC was calculated by integration. Statistical significance is **P < 0.01 and ***P < 0.001 compared with ZZW-115–treated cells (2-way ANOVA, Bonferroni’s post hoc test). MiaPaCa-2 cells were incubated in 5 μM ZZW-115 compound or 8 nM paclitaxel in the presence or absence of Z-VAD-FMK (20 μM), and (G) caspase 3/7 activity and (H) LDH release were measured. MiaPaCa-2 cells were incubated in 5 μM ZZW-115 or 8 nM paclitaxel in the presence or absence of Nec-1 (40 μM), and (I) caspase 3/7 activity and (J) LDH release were measured. Statistical significance is *P < 0.05, **P < 0.01, and ***P < 0.001 compared with ZZW-115–treated cells; #P < 0.05 and ##P < 0.01 compared with paclitaxel-treated cells (2-way ANOVA, Bonferroni’s post hoc test). Data represent mean ± SEM, n = 3.

