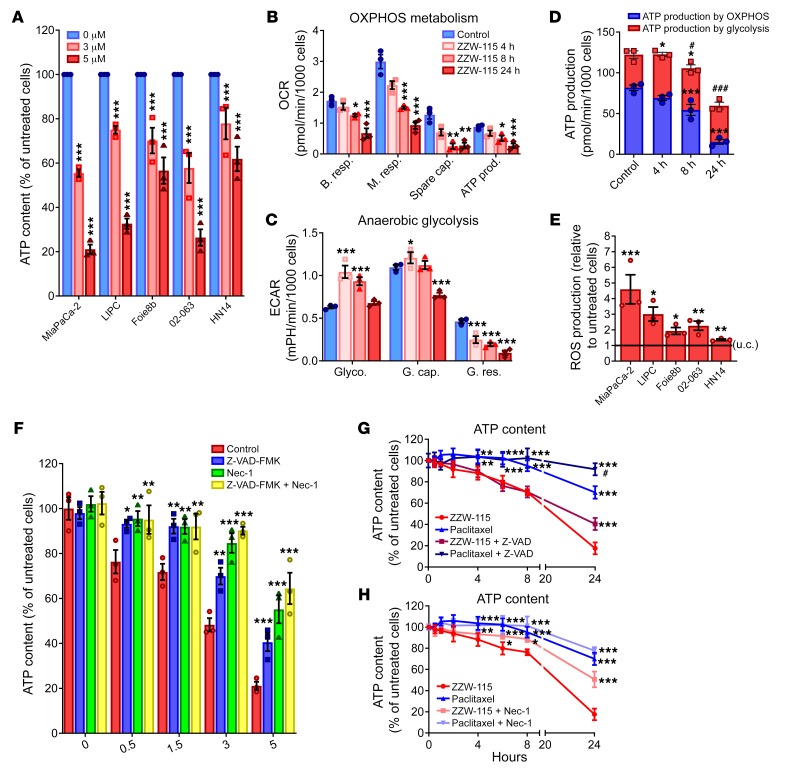
Figure 5. ZZW-115 treatment induces a decrease in ATP production and induces a ROS overproduction.
(A) ATP content measured in a panel of pancreatic cancer cell lines incubated at 3 or 5 μM ZZW-115 for 24 hours. (B) OXPHOS metabolism, reflected by oxygen consumption rate (OCR) levels for basal respiration (B. resp.), maximal respiration (M. resp.), spare capacity (Spare cap.), and ATP production (ATP prod.) and (C) anaerobic glycolytic metabolism reflected by extracellular acidification rate (ECAR) levels for glycolysis (Glyco.), glycolytic capacity (G. cap.), and glycolysis reserve (G. res.) were measured in MiaPaCa-2 cells treated with 3 μM ZZW-115 compound for 4, 8, or 24 hours. (D) ATP production by OXPHOS and anaerobic glycolysis were determined in MiaPaCa-2 cells treated with 3 μM ZZW-115 for 4, 8, or 24 hours. Statistical significance is *P < 0.05, **P < 0.01 and ***P < 0.001 for OXPHOS or glycolysis compared with control cells; #P < 0.05 and ###P < 0.001 for total ATP compared with control cells (2-way ANOVA, Bonferroni’s post hoc test). (E) ROS production was detected using MitoSOX Red by flow cytometry analysis on a panel of pancreatic cancer cell lines incubated with ZZW-115 at 3 μM. Statistical significance: *P < 0.05, **P < 0.01, and ***P < 0.001 compared with control cells (Student’s 2-tailed unpaired t test). (F) MiaPaCa-2 cells were incubated at a ZZW-115 concentration range of 0.5–5 μM in the presence or absence of Z-VAD-FMK (20 μM) or/and Nec-1 (40 μM) for 24 hours, and ATP content was measured. (G and H) MiaPaCa-2 cells were incubated with 5 μM ZZW-115 or 8 nM paclitaxel in the presence or absence of Z-VAD-FMK (20 μM) or Nec-1 (40 μM), and ATP content was measured. Statistical significance: *P < 0.05, **P < 0.01, and ***P < 0.001 compared with ZZW-115–treated cells; #P < 0.05 and ###P < 0.001 compared with paclitaxel-treated cells (2-way ANOVA, Bonferroni’s post hoc test). Data represent mean ± SEM, n = 3.

