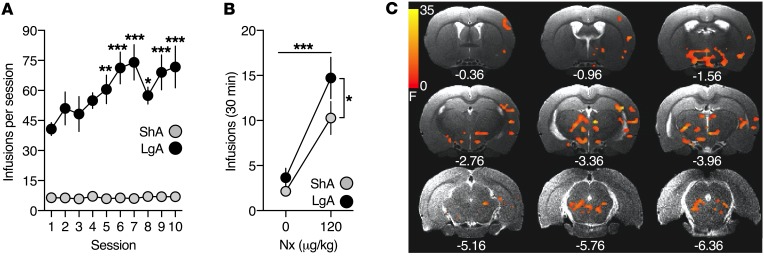
Figure 1. Conditioned heroin withdrawal engages negative emotional learning neurocircuits.
(A) Heroin intake during ShA and LgA self-administration sessions. A significant heroin-access × session interaction was observed (F9,171 = 4.25, P = 0.002; 2-way repeated-measures ANOVA). (B) Heroin intake following saline (0 μg/kg, s.c.) or naloxone (Nx) (120 μg/kg, s.c.) treatments during cue pairings, presented as the average of the 4 cue pairings per treatment. Significant main effects of treatment (F1,19 = 35.5, P < 0.0001) and heroin access (F1,19 = 4.215, P = 0.05) were found (2-way repeated-measures ANOVA). (C) Statistical map (F values) of the cue × heroin-access BOLD signal interaction following whole-brain 3-way ANCOVA, with respiration as the covariate (P < 0.01; 233 voxels, corrected for multiple comparisons). The upsampled (to anatomical images) statistical map is superimposed on anatomical coronal images from a representative subject. Below each section is the anterior-posterior distance from bregma (in mm). Data represent mean ± SEM. *P < 0.05; **P < 0.01; ***P < 0.001 (different from session 1 and corrected for multiple comparisons in A). n = 11 ShA rats; n = 10 LgA rats.

