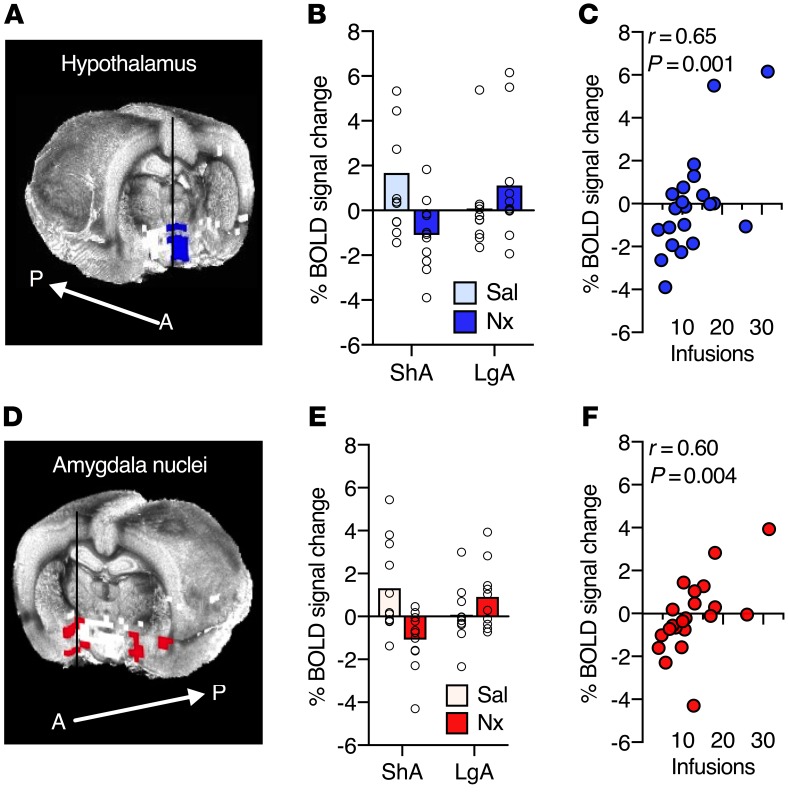
Figure 2. Withdrawal severity during conditioning is associated with changes in the hypothalamic and amygdala nuclei BOLD signal in response to the naloxone-paired cue.
(A) Hypothalamic cluster extracted from the BOLD signal cue × heroin-access interaction shown in Figure 1C, with a 3D rendered whole-brain underlay. A, anterior; P, posterior. (B) Mean percentage of BOLD signal change from baseline in the hypothalamic cluster to the cue-only presentations. Dot plot displays individual data for each condition. Sal, saline. (C) Scatter plot of heroin intake during naloxone conditioning and BOLD signal response in the hypothalamic cluster to the naloxone-paired cue across both heroin-access groups (Pearson’s correlation). (D) Amygdala nuclei extracted from the BOLD signal cue × heroin-access interaction shown in Figure 1C, with a 3D rendered whole-brain underlay. (E) Mean percentage of BOLD signal change from baseline in amygdala nuclei to the cue-only presentations. Dot plot displays individual data for each condition. (F) Scatter plot of heroin intake during naloxone conditioning and BOLD signal response in the amygdala nuclei to the naloxone-paired cue across both heroin-access groups (Pearson’s correlation). n = 11 ShA rats; n = 10 LgA rats.

