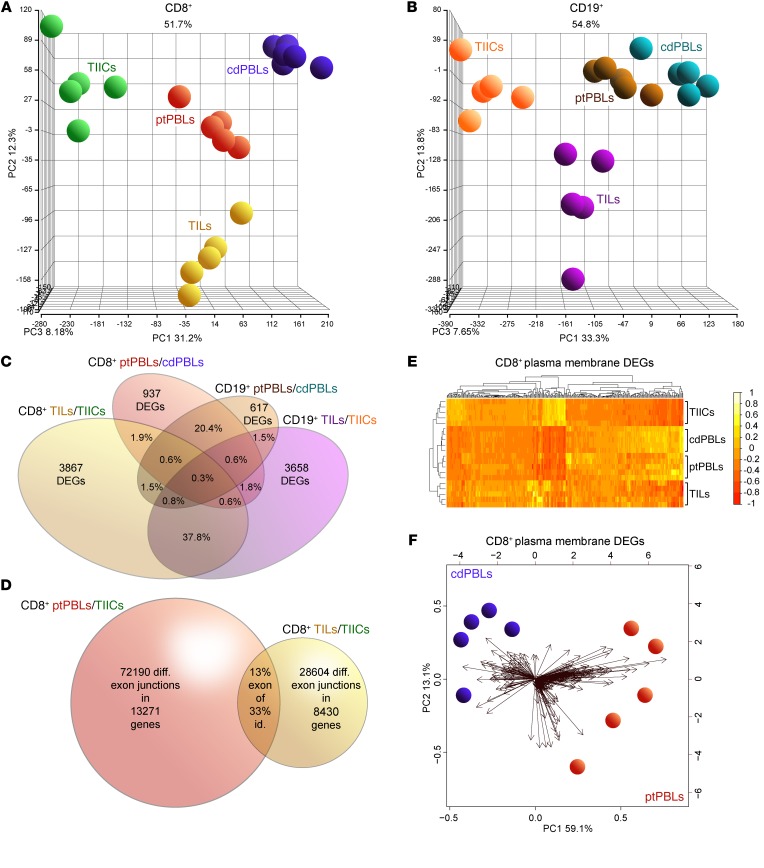
Figure 1. Distinct comprehensive transcriptomics from paired CD8+ and CD19+ profiles from ccRCC blood, tumors and tissues, and control donor blood isolates.
(A and B) PCA demonstrating distinct DEG profiles from comprehensive HTA 2.0 microarray analyses of (A) CD8+ (n = 15) and (B) CD19+ (n = 15) immune cell subsets from TILs and TIL-Bs, TIICs, and circulating ptPBLs, and cdPBLs (n = 10). (C) Four-way Venn diagram demonstrating percentage overlaps of DEGs identified by microarrays across different source biospecimens analyzed. (D) Venn diagram showing that ptPBLs have greater numbers of differentially represented exon-exon PSR junctions compared with TILs, relative to TIICs from paired CD8+ samples (P < 0.05; ANOVA, Transcriptome Analysis Console v.3, Affymetrix). Thirteen percent of shared PSR junctions exist between ptPBLs and TILs, representing 33% of total genes common to ptPBLs and TILs having shared isoform identity. (E) GO PM proteins identified by Partek and unsupervised hierarchical clustering algorithm-generated heatmaps demonstrating that the 4 different CD8+ isolates are stratified according to PM, using log2 expression values applying the Euclidean distance metric and complete linkage clustering method (R programming language; R-studio). Heatmaps demonstrate the unsupervised clustering of PBL isolates as most closely related, with TILs and TIICs at their boundaries, suggesting that their profiles may be influenced by the cancer microenvironment. (F) Feasibility of using PM-associated proteins toward identifying pan-cancer DEGs that can stratify patients is demonstrated by PCA biplots of PM DEGs from CD8+ cdPBL and ptPBL isolates created on log2 values using the biplot function (R; R-studio). diff., differential; id., identity; PSR, probe-selected region.

