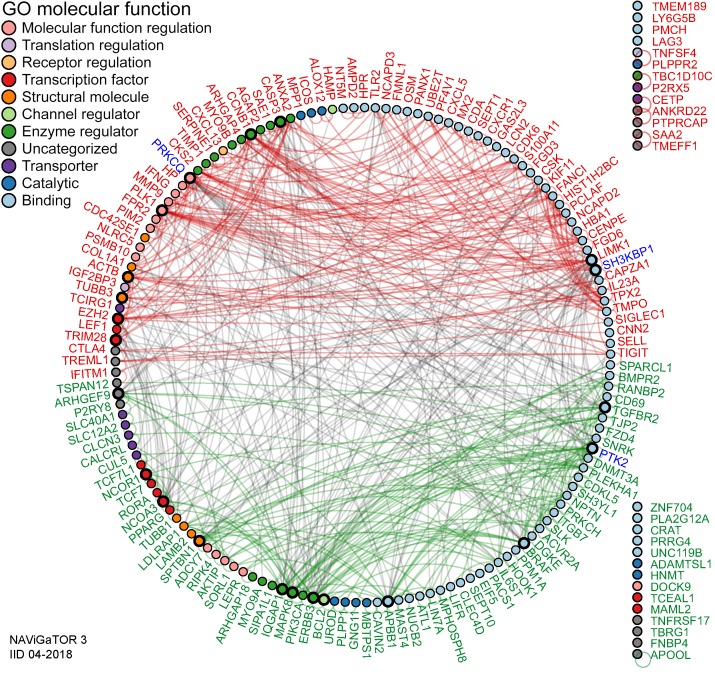
Figure 3. Pan-cancer DEGs have extensive PPI.
PPI networks of the top 200 DEGs. A high PPI enrichment value (P = 1.85 × 10⁻¹⁰) indicating interactions among these DEGs is very significant relative to proteins drawn at random, indicating a biological connection as groups in defined pathways. Pan-cancer agonistic (red) and antagonistic (green) DEGs (nodes/circles) and their interactions (edges/lines) demonstrate groupings of these 2 pan-cancer DEG subclasses, and gray lines highlight interactions between them. Noninteracting DEGs are on the right (NAViGaTOR v3 and IID v04-2018). DEG nodes are colored according to GO Molecular Functions listed in the top left legend. Larger node circles represent the highest degree of DEGs interactors within the network, and blue DEG names represent centrality of interactors (as determined by the all-pairs shortest path algorithm in NAViGaTOR).

