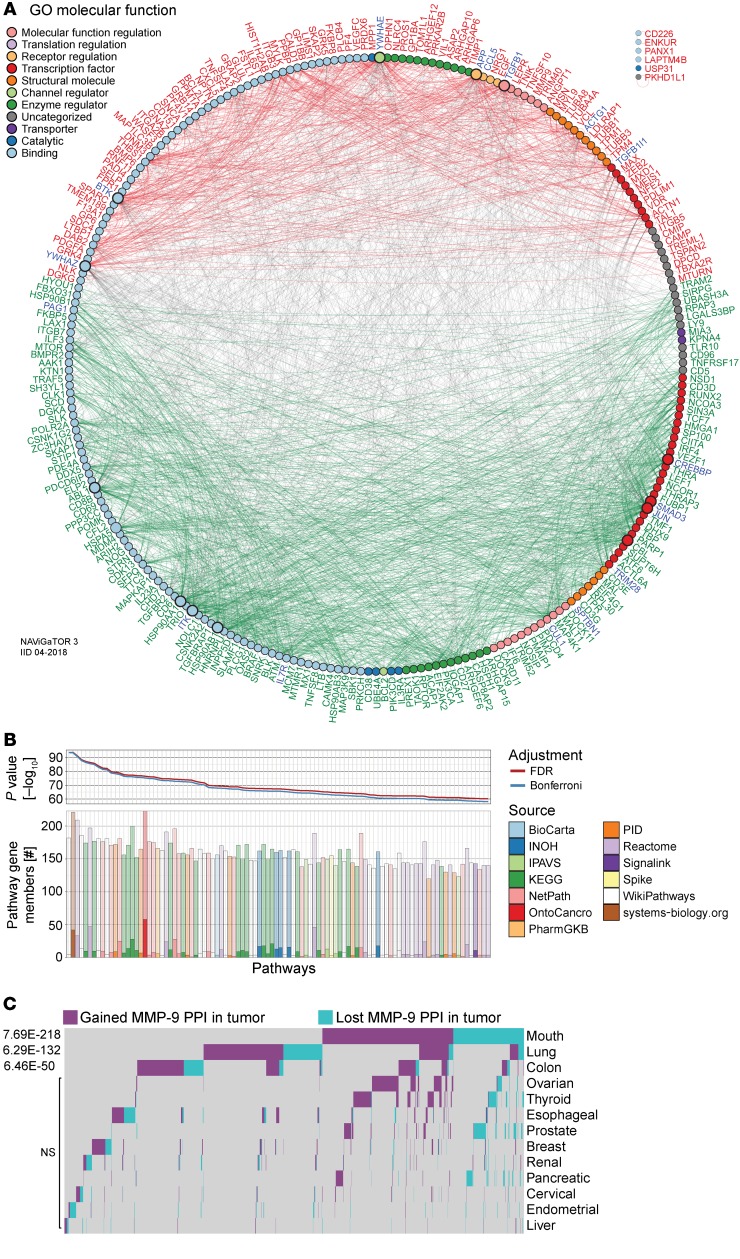
Figure 8. Enrichment of disrupted MMP9 pathways in ccRCC patient circulating cells and various cancers.
(A) PPI network linking pan-cancer proteins from significant MMP-9 pathways-associated ccRCC ptPBL DEGs. DEGs (nodes/circles) and their interactions (edges/lines) are shown in red (high expression) and green (low expression), and gray edges highlight interactions between them (NAViGaTOR v3 and IID v04-2018). Noninteracting proteins are listed on the top right. DEG nodes are colored according to GO Molecular Functions listed in the legend. Larger node circles, represent the high degree of interactions with all other DEGs, and blue DEG names represent centrality of interactors. (B) Pathway enrichment analysis graphs depicting results of pathDIP analysis for MMP-9 pathway interactors from correlation analyses. Upper panel shows significance of enrichment obtained for individual pathways (P value, –log10) adjusted for multiple testing using FDR and Bonferroni methods. Lower bar plot shows overlap between query genes and members of individual pathways. Respective numbers of known and predicted pathway members are distinguished by opacity, and fill color indicates source of given pathway. Plots are restricted to the top 100 most significant (see Supplemental Figure 7A for the full pathways). (C) Tissue-specific disrupted PPI networks among MMP-9 interactors in cancer. Gained and lost MMP-9 PPIs in 13 nonmalignant and pretreatment tumors highlighting its tissue-specific role in cancer, where 106 disrupted MMP-9 PPIs were identified (n = 2801) (see Supplemental Figure 7). A total of 1814 disrupted PPIs were found, 81% of which are disrupted in only 1 or 2 tissues and only less than 5% are present in more than 3 tissues.

