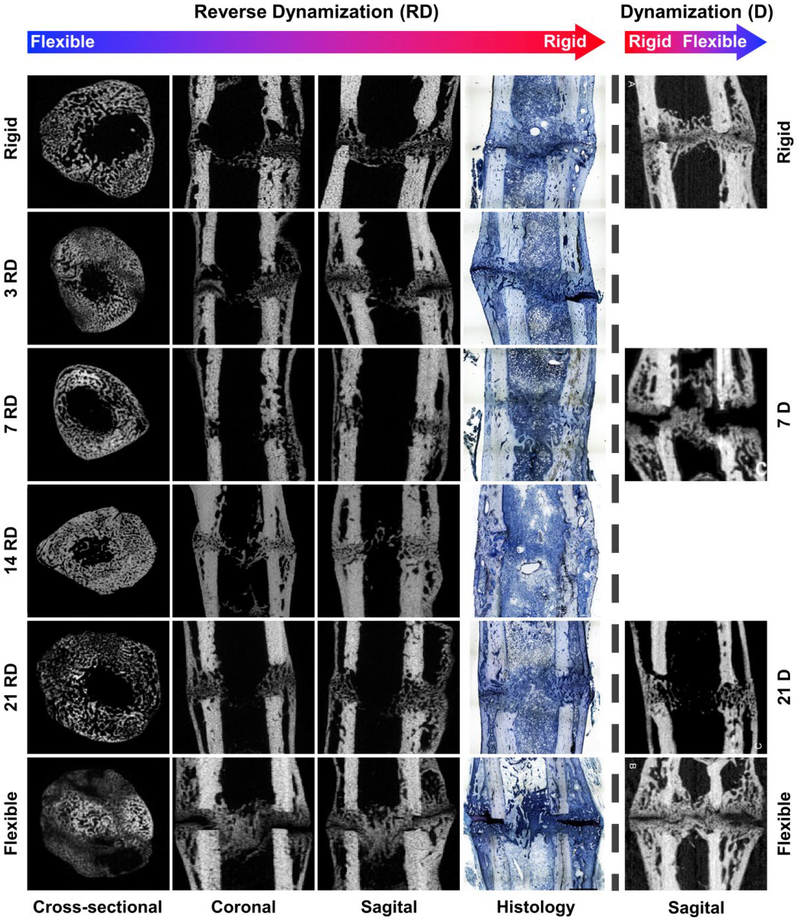
Figure 3.
Micro-computed tomography and histology images of 1 mm osteotomy defects 35 days postoperatively after reverse dynamization and standard, forward dynamization. Left hand side of dashed vertical line: reverse dynamization (flexible to rigid fixation) initiated at 3, 7, 14 and 21 days, and compared to constant stiff and constant flexible fixation control groups. Histological sections were stained with paragon: white and blue: fibrous tissue; purple: cartilage; light blue/white: bone (Images were adapted from reference 40). Right hand side of dashed vertical line: Micro-computed tomography images of 1 mm osteotomy at 35 days postoperatively after dynamization (rigid to flexible fixation) at 7 and 21 days, and compared to constant rigid and constant flexible fixation control groups.

