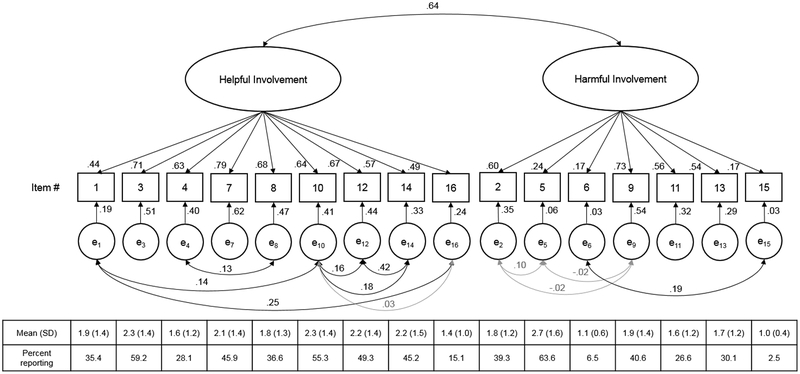
Figure 1. Confirmatory factor analysis (Study 2).
Standardized factor loadings are shown on the paths from the latent variable to each indicator (item), all p<.001; squared multiple correlations are shown on the paths from each indicator to each error term, all p<.001. Curved arrows depict correlations between error terms that were not constrained to zero based on hypothesized shared error variance for certain items (correlations non-significant at p<.05 are grayed). Mean (standard deviations) and percent reporting a score > 1 = “never in the past month” for each item are shown across the bottom.

