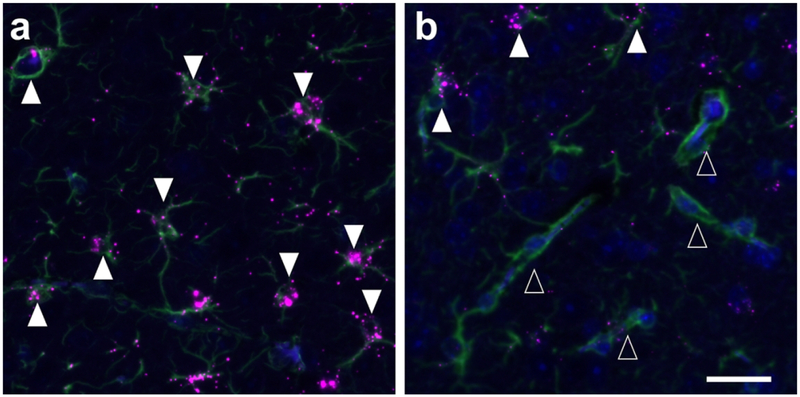
Figure 10.
We observed occasional FGFR1+/NeuN+ neurons and FGFR2+/Iba1+ glia in the hypothalamus (ARC, VMH, DMH) and hippocampus, but these were a minority of observed total neuron or glial cell populations. GFAP+ astrocytes, on the other hand, consistently expressed high levels of FGFR3 (closed arrows, 8a), with the exception of astrocytes surrounding presumptive blood vessels (open arrows, 8b). Scale bar = 25 μm.

