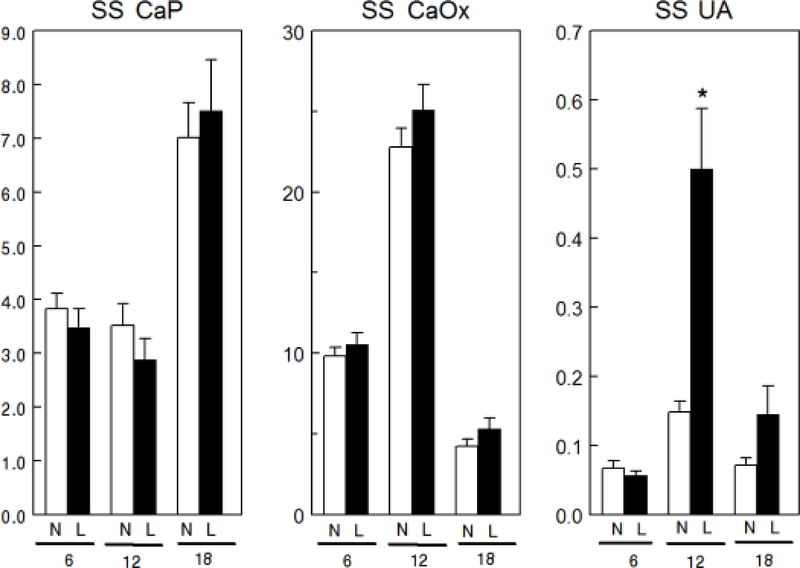
Figure 3.
Urine supersaturation (SS) for calcium phosphate (CaP), calcium oxalate (CaOx) and uric acid (UA) for GHS rats fed a normal (N) or low (L) sodium (Na) diet. Urine was collected for four 24h periods at 6, 12 and 18 weeks to determine solute levels that were used to calculate relative supersaturation as described in the Concise Methods. Values for relative supersaturation are mean ± SE (n=11) and are unitless. *p<0.05 for L compared to N at the same time period.

