Figure 5.
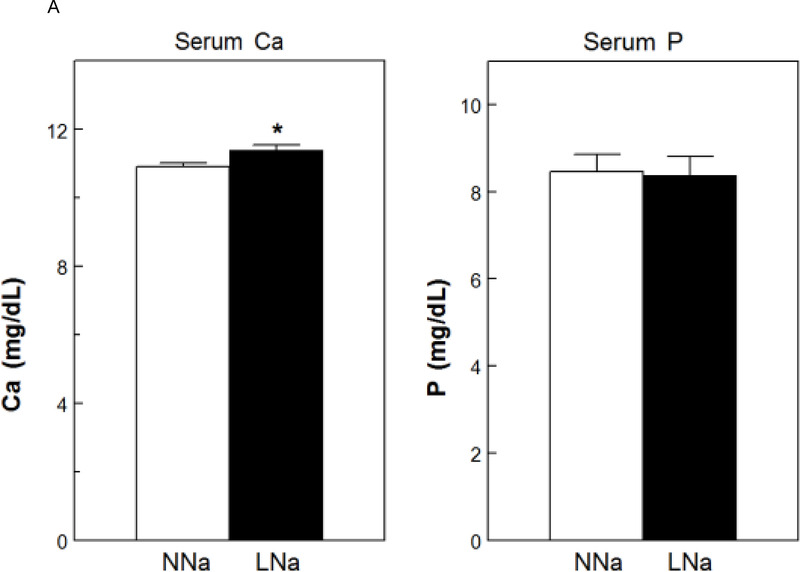
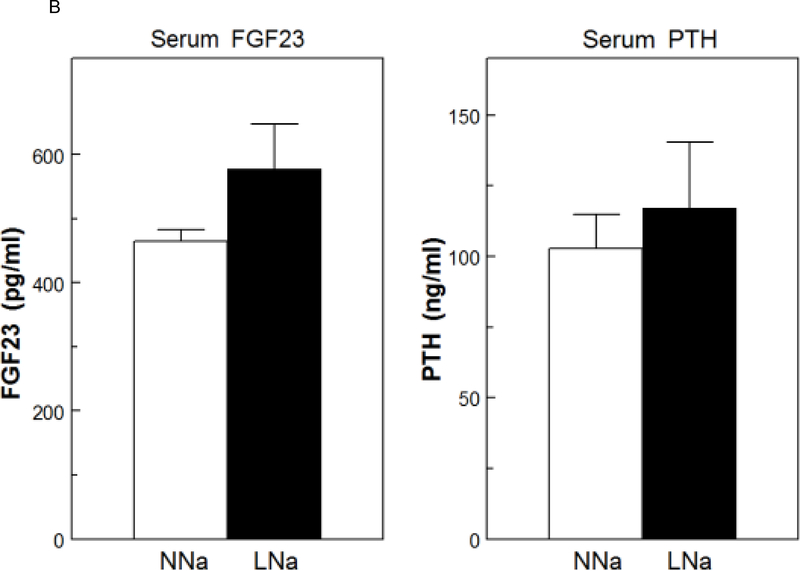
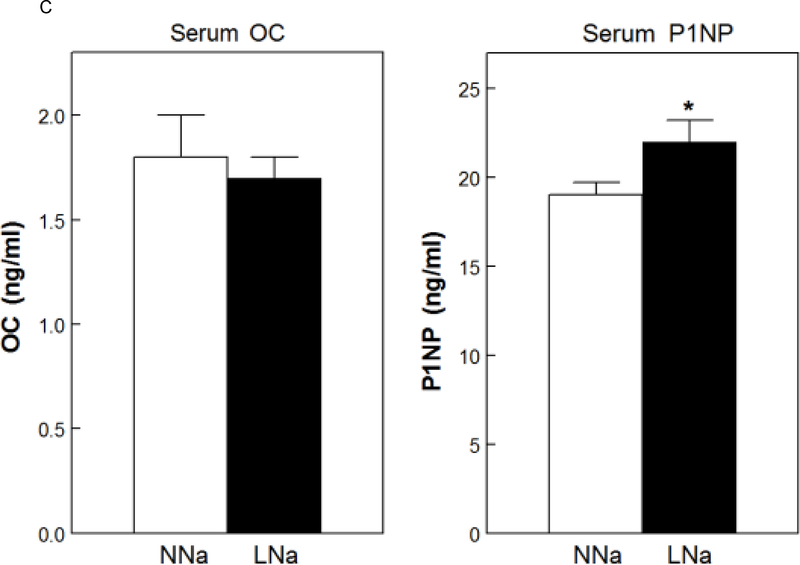
Serum calcium (Ca), phosphorus (P), fibroblast growth factor 23 (FGF23), parathyroid hormone (PTH), osteocalcin (OC) and amino terminal propeptide of type 1 collagen (P1NP) at the conclusion of the 18 week study. Serum levels were determined as described in the Concise Methods. A) Serum Ca and P on normal Na diet (NNaD) compared to low Na diet (LNaD); B) Serum FGF23 and PTH on NNaD compared to LNaD; C) Serum OC and P1NP on NNaD compared to LNaD. Values are mean ± SEM (n=11). *p<0.05 for LNaD compared to NNaD.


