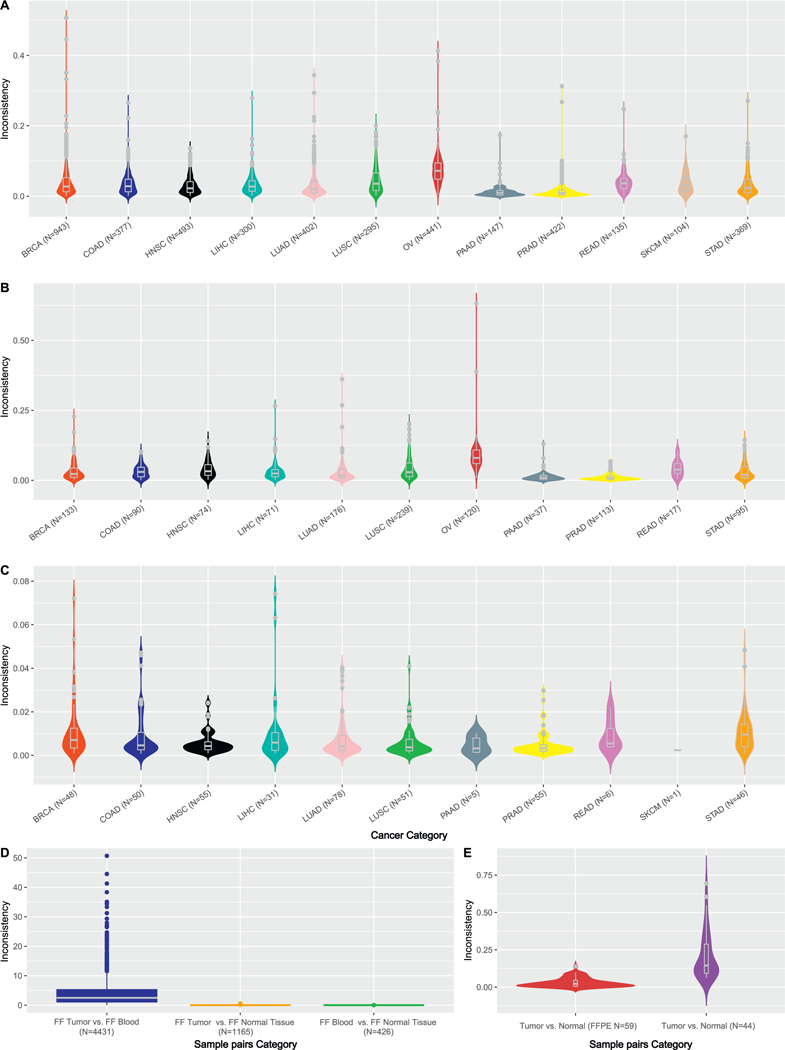
Fig. 1.

SNP inconsistencies are presented in this fig. A. SNP inconsistency rates between blood and tumor tissues by cancer type. Outliers (> 0.1) can be observed within each cancer type. B. SNP inconsistency rates between normal tissues and tumor tissues. SKCM does not contain any normal tissue, thus was not shown. C. SNP inconsistency rates between blood and normal tissue. The lowest inconsistencies were observed in this comparison, which can be explained by the germline characteristics of both blood and normal tissue. D. SNP inconsistency rates in three comparison scenarios (freshly frozen samples were used). E. SNP inconsistency rates for FFPE samples were entailed. When both samples in the pair were FFPE, lower inconsistency rates were observed. When one of the samples in the pair was FFPE, higher inconsistency rates were observed. This suggests potential batch effect during FFPE processing might have caused systematic errors.
