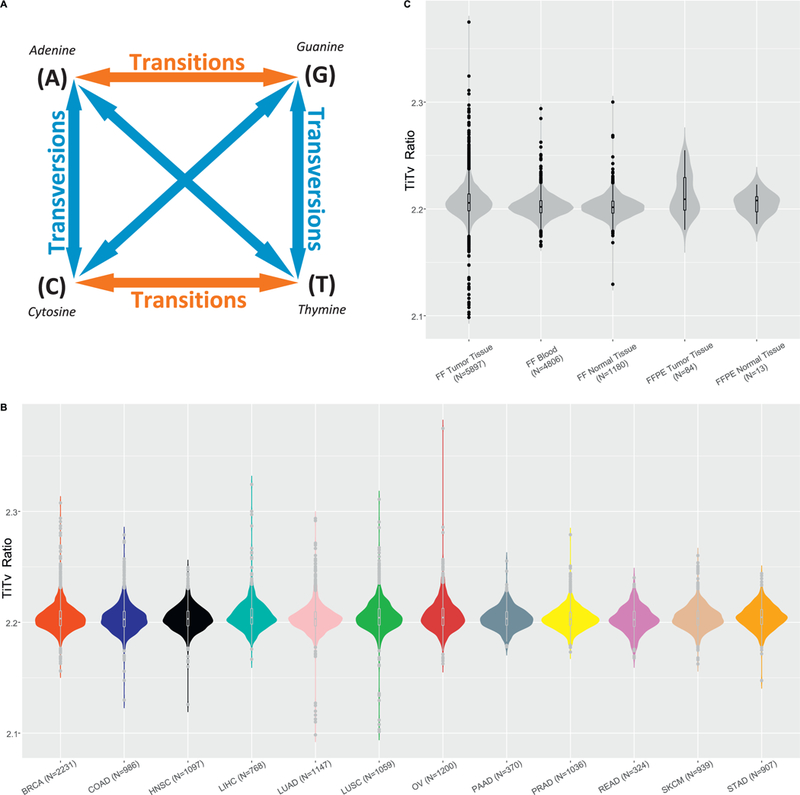
Fig. 3.

A. A diagram describing transition and transversion. The nucleotide substitutions alone the red arrows denote transition, the nucleotide substitution alone the blue arrows denotes transversion. If all substitutions are random, there should be twice the number of transversions than transitions. However, in reality, the number of transition is ~2–3 times more than transversion in the exome regions. B. Ti/Tv ratio per sample by cancer type. C. Ti/Tv ratio per sample by sample categories.
