
Figure 3.
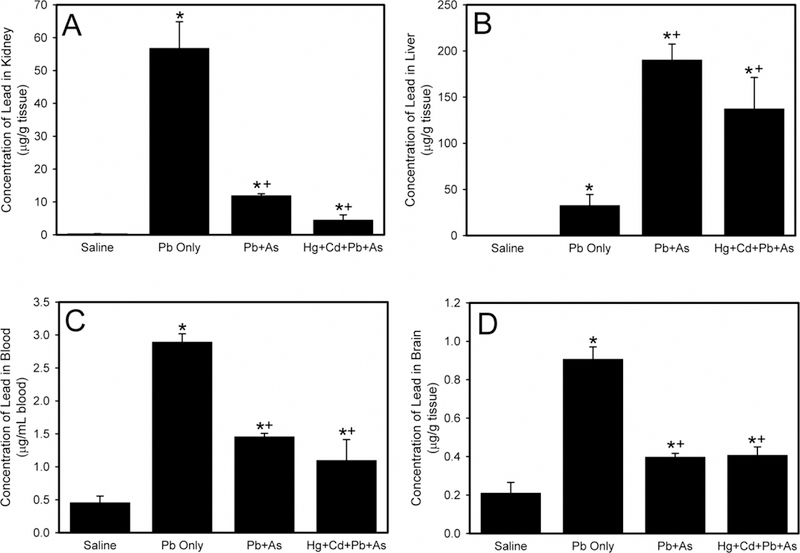
The levels of lead (Pb) in kidney (A), liver (B), blood (C), and brain (D) following exposure of Wistar rats to saline, Pb only, lead and arsenic (Pb + As), or mercury, cadmium, lead, and arsenic (Hg + Cd + Pb + As). *, significantly different (p < 0.05) than the mean of the corresponding group of rats exposed to saline. +, significantly different (p < 0.05) than the mean of the corresponding group of rats exposed to Pb only.