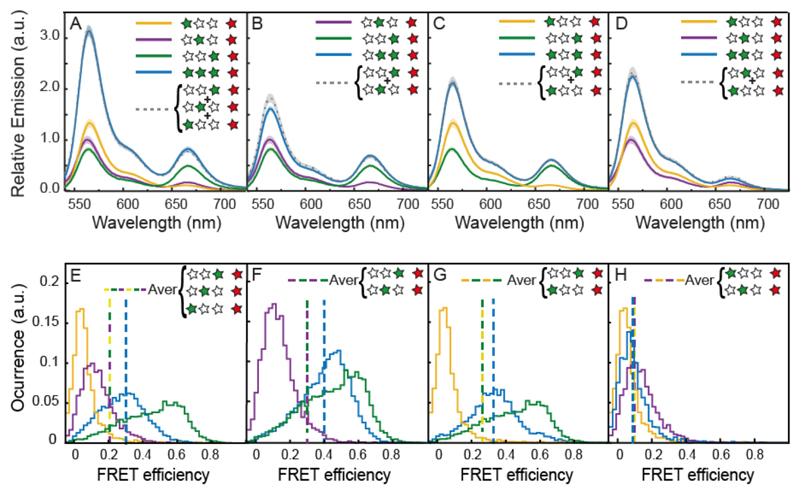
Figure 3. Two-color cascade.
(Top panel A-D) bulk emission spectra of constructs carrying a variable number of Cy3 dyes and a single Cy5 acceptor. The recorded emission intensities are normalized by the intensity of the Cy5 emission after Cy5 excitation in order to account for differences in sample concentration. The shading around the plotted lines indicate the error of the mean (the final spectra are the result of an average of multiple measurements on at least 6 different sample batches). The comparison between the spectra of the constructs containing two Cy3 dyes (blue lines) and the mathematical sum of the spectra of the respective partial constructs with only one Cy3 (gray lines) is shown for XG2G3R (A), G1XG3R (B), G1G2XR (C) and G1G2G3R (D). (Bottom panel E-H) SM FRET histograms of constructs carrying a variable number of Cy3 dyes and a single Cy5 acceptor. Occurrence values are normalized by the histogram areas. Each histogram contains at least 2000 events. Dashed lines indicate the average efficiency.

