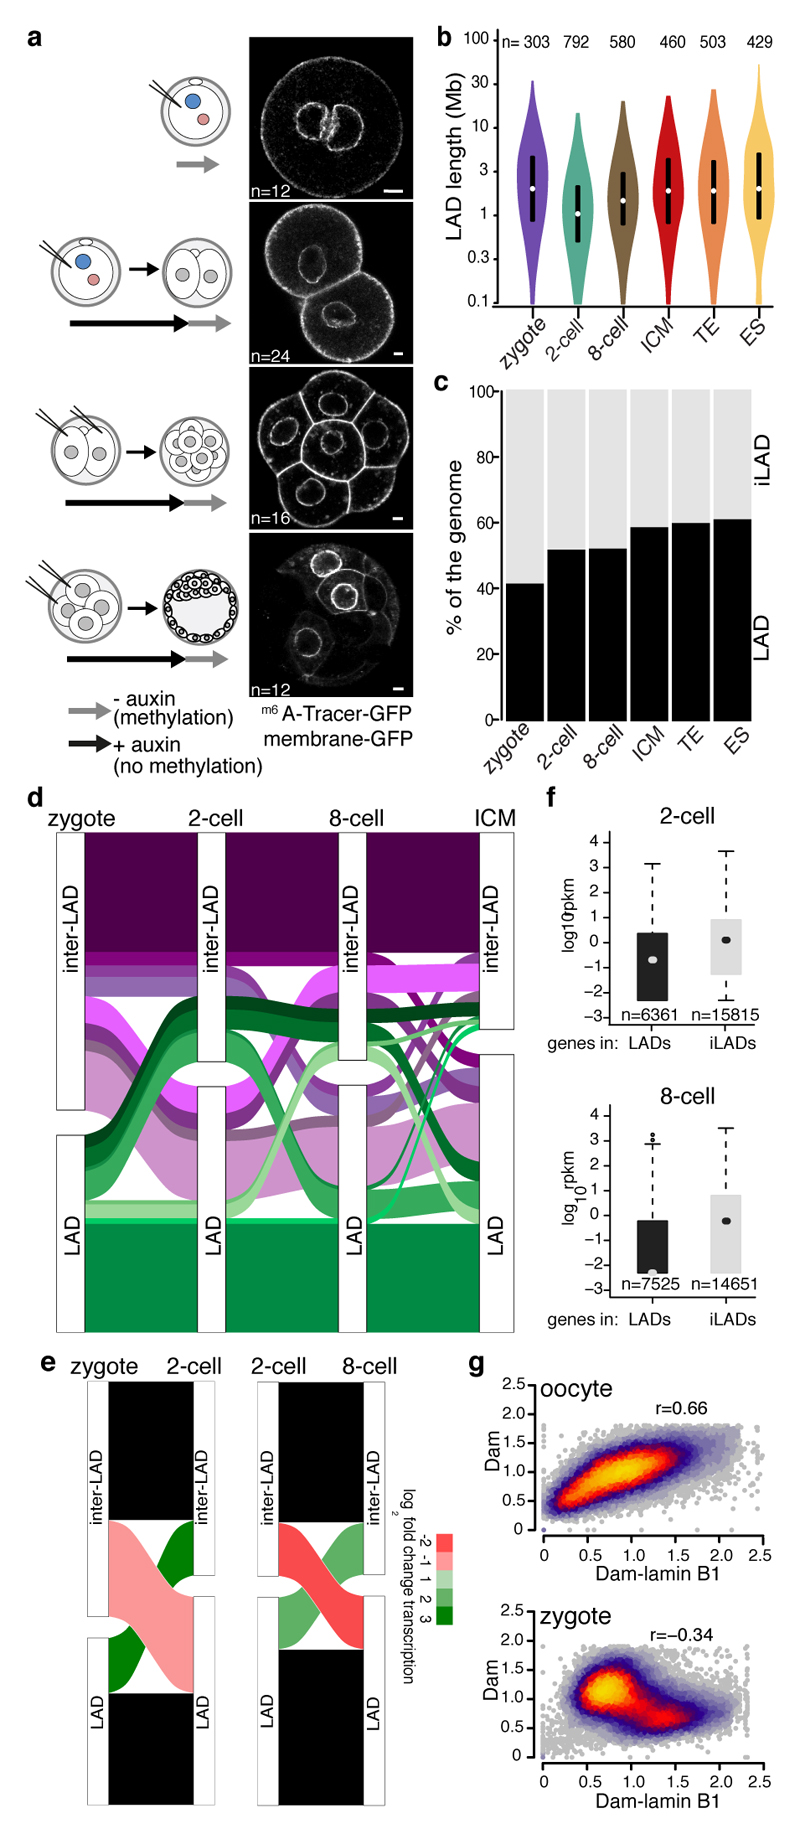
Figure 1. LADs establish de novo after fertilisation.
a, Experimental design. LAD methylation upon auxin removal, highlighted by GFP-m6ATracer. GAP43-EGFP expression marks cell membrane. Scale bar: 5 μm. Experiments were repeated at least five times. c, Distribution of LAD domain length. Violin plots show the 25th and 75th percentiles (black lines), median (circles) and the smallest/largest values at most 1.5 * IQR. n = number of LADs. d, Genomic LAD coverage. e, Alluvial plot showing LAD reorganisation during preimplantation development. f, Alluvial plot showing median log2 fold-change expression of genes20 for changing LADs between zygotes, 2-cell and 8-cell stages. g, RNAseq expression values20 of genes within LADs or iLADs. Box plots show the 25th and 75th percentiles (box), median (circles), the smallest/largest values at most 1.5 * IQR of the hinge (whiskers) and outliers (black circles). n = number of genes. h, Genome-wide scatter plots (100-kb bins) of Dam and Dam-lamin B1 scores in oocytes and zygotes. n = 3 biological independent samples.

