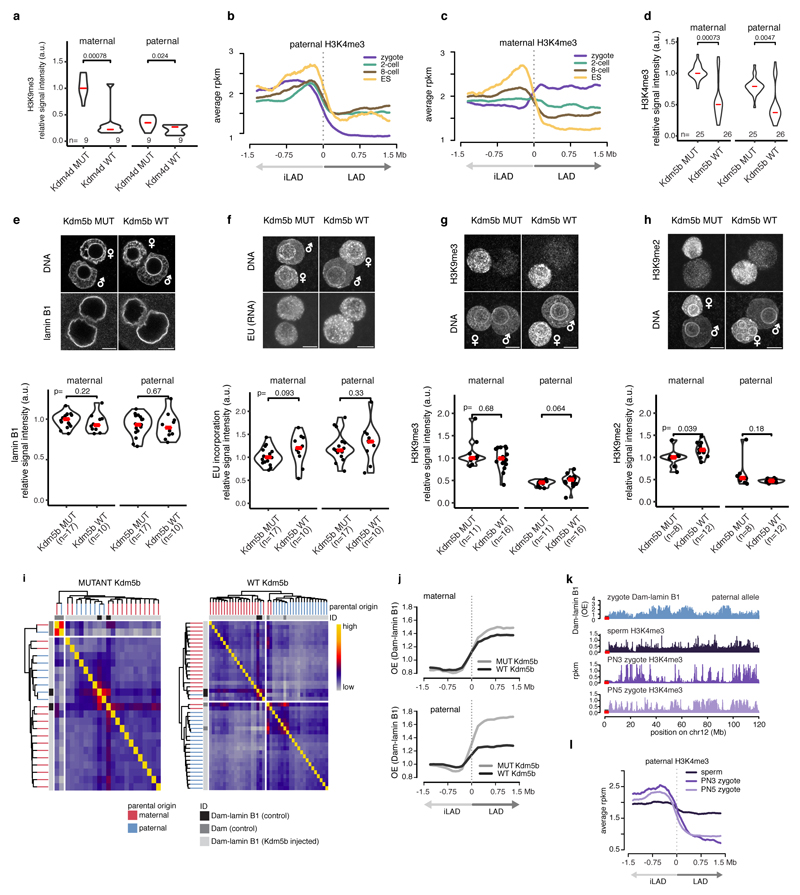
Extended Data Figure 6. Overexpression of Kdm5b histone demethylase abrogates paternal LAD establishment in the zygote.c.
a, Quantifications of immunostaining with H3K9me3 in zygotes injected with wild-type and mutant KDM4D. Violin plots show the values at most 1.5 * IQR and median (red lines). n = at least 3 biological independent samples. Wilcoxon rank-sum test p-values shown (two-sided). Scale bars represent 10 μm. b, Average paternal-specific H3K4me3 signal at paternal-specific LAD boundaries of each respective embryonic stage. c, Average maternal specific H3K4me3 signal at maternal specific LAD boundaries of each respective embryonic stage. d, Quantification as described for a but with H3K4me3. e, Immunostaining and quantification of lamin B1 localisation in the Kdm5b-expressing zygotes. Violin plots show the values at most 1.5 * IQR and median (red lines). n = at least 3 biological independent samples. Wilcoxon rank-sum test p-values shown (two-sided). Scale bars represent 10 μm. f, Global transcription detection (EU incorporation) and quantification in H3K4me3 in the Kdm5b-expressing zygotes. Violin plots show the values at most 1.5 * IQR and median (red lines). n = at least 3 biological independent samples. Wilcoxon rank-sum test p-values shown (two-sided). Scale bars represent 10 μm. g, Immunofluorescent staining of H3K9me3 in MUT and WT KDM5B-expressing embryos, violin plots show the quantified levels of H3K9me3. Violin plots show the values at most 1.5 * IQR and median (red lines). n = at least 3 biological independent samples. Wilcoxon rank-sum test p-values shown (two-sided). Scale bars represent 10 μm. h, Immunofluorescent staining of H3K9me2 in MUT and WT KDM5B injected embryos, violin plots show the quantified levels of H3K9me2. Violin plots show the values at most 1.5 * IQR and median (red lines). n = at least 3 biological independent samples. Wilcoxon rank-sum test p-values shown (two-sided). Scale bar represents 10 μm. i, Hierarchical clustering based on Pearson correlation of Dam-lamin B1 signal from single pronuclei of wild-type and mutant Kdm5b-injected zygotes (samples from 3 independent experiments). For comparison, population average Dam and Dam-lamin B1 signals are included as grey and black squares, respectively. j, Average Dam-lamin B1 signal at LAD boundaries in hybrid H3K4me3 manipulated embryos. Signal shown in maternal genome (top) and paternal genome (bottom). k, Chromosome profiles of H3K4me3 ChIP-seq20 signal from sperm, early-, and late-zygotes. l, Average H3K4me3 levels in sperm, early-and late-zygotes at paternal zygotic LAD borders.

