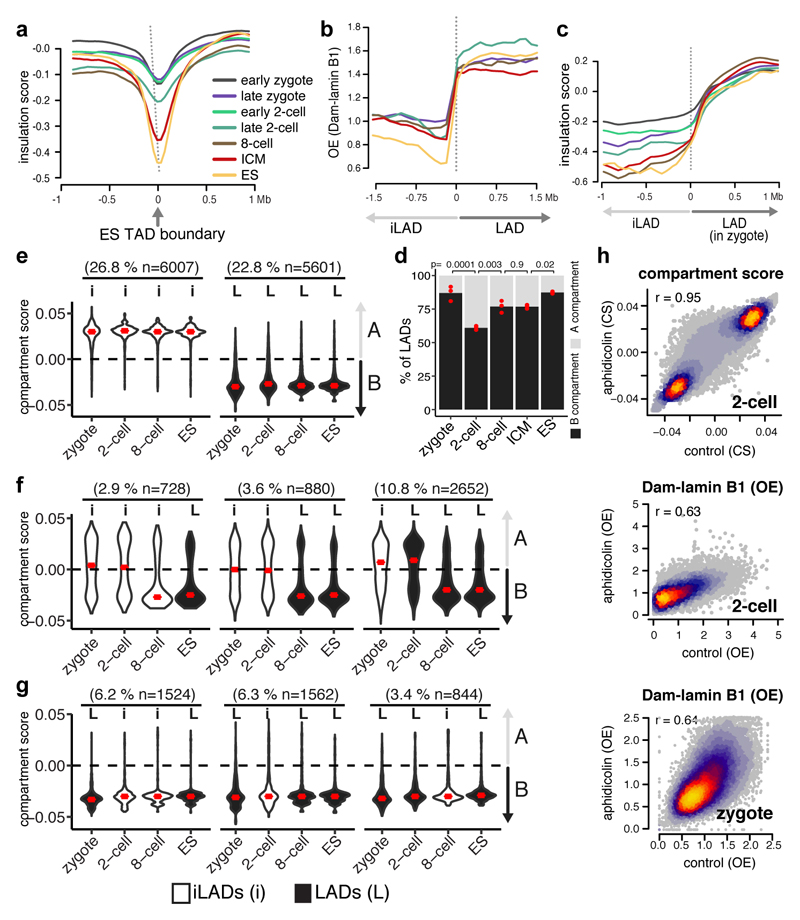
Figure 3. Replication unrelated formation of LADs is concordant with A/B compartments and precedes TAD structuring.
a, Insulation scores from Hi-C data plotted over ES TAD boundaries13. b, Dam-lamin B1 scores plotted over LAD boundaries. c, Insulation scores from Hi-C data plotted over zygotic LAD boundaries. d, Percentage of LADs overlapping A or B compartments. Bars represent the mean of three biological replicates indicated by red dots. p-values represent a post-hoc Tukey-test (two-sided). e, f, g, Violin plots of compartment scores for 100-kb genomic regions with different LAD dynamics. iLADs (‘I’) and LADs (‘L’) in the indicated stages and ES. Number in parentheses denote the percentage of the genome covered per category. Violin plots show the values at most 1.5 * IQR and median (red lines). Compartment scores are calculated based on 3 biological independent samples. n = number of bins. h, Genome-wide scatter plots of compartment scores (CS) and DamID scores in control and aphidicolin-treated zygotes and 2-cell embryos. n = 3 biological independent samples, r = Spearman’s rho.

