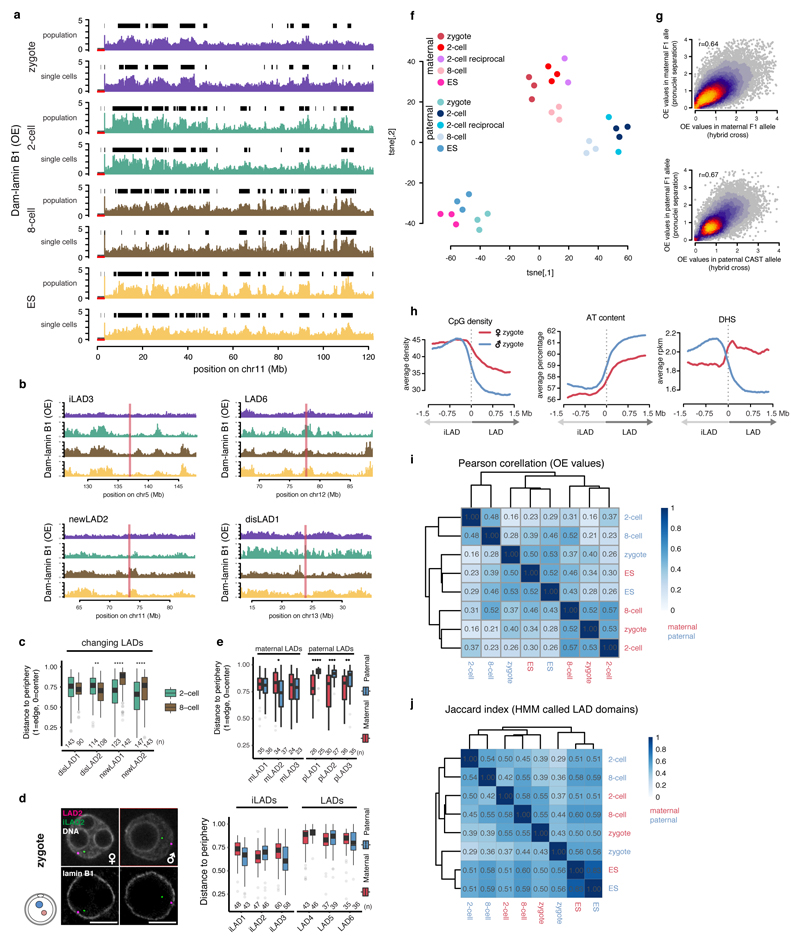
Extended Data Figure 4. Single cells show consistent LAD patterning within the same developmental stages but parental genomes display distinct features.
a, Chromosome profiles of population average (n = 3) and single-cell average Dam-lamin B1 signals. Black boxes represent LAD domains called by Hidden-Markov modelling. b, Genomic location of example DNA-FISH probes projected on Dam-lamin B1 chromosome profiles. c, Quantification of 3D preserved DNA-FISH spot distances to the nuclear periphery in 2-cell and 8-cell embryos of probes in regions that change LAD status from 2- to 8-cell stage according to DamID. Box plots show the 25th and 75th percentiles (box), median (solid lines), the smallest/largest values at most 1.5 * IQR of the hinge (whiskers) and outliers (grey circles). n = number of DNA-FISH spots from at least 3 biological independent samples. Wilcoxon rank-sum test p-values shown (two-sided). **: p <= 0.01, ****: p <= 0.0001. d, Images of 3D DNA-FISH in zygote pronuclei. Quantification shows distance to the nuclear periphery. Scale bars represent 10 μm. Box plots show the 25th and 75th percentiles (box), median (solid lines), the smallest/largest values at most 1.5 * IQR of the hinge (whiskers) and outliers (grey circles). n = number of DNA-FISH spots from at least 3 biological independent samples. e, Distance quantification of DNA-FISH probes in maternal and paternal specific LADs in zygotes. Box plots show the 25th and 75th percentiles (box), median (solid lines), the smallest/largest values at most 1.5 * IQR of the hinge (whiskers) and outliers (grey circles). n = number of DNA-FISH spots from at least 3 biological independent samples. Wilcoxon rank-sum test p-values shown (two-sided). *: p <= 0.05 **, : p <= 0.01, ***: p <= 0.001,****, : p <= 0.0001. f, t-SNE representation of the triplicate allelic Dam-lamin B1 population samples, including 2-cell embryos from reciprocal crosses. n = 3 biological independent samples. g, Scatter plot comparison between average Dam-lamin B1 signals obtained from pronucleus separated and hybrid zygote DamID. n = biological independent samples. Maternal pronucleus (n = 10), paternal pronucleus (n = 15) and hybrid zygote (n = 3). r = Spearman’s rho. h, Average CpG density, AT content and DHS sites over LAD boundaries ±1.5 Mb defined specifically for maternal and paternal alleles in zygotes. i, Allelic correlation matrix (Pearson) of OE scores form Dam-lamin B1 embryos. j, Jaccard indexes calculated over HMM called LAD domains.

