
Figure 2.
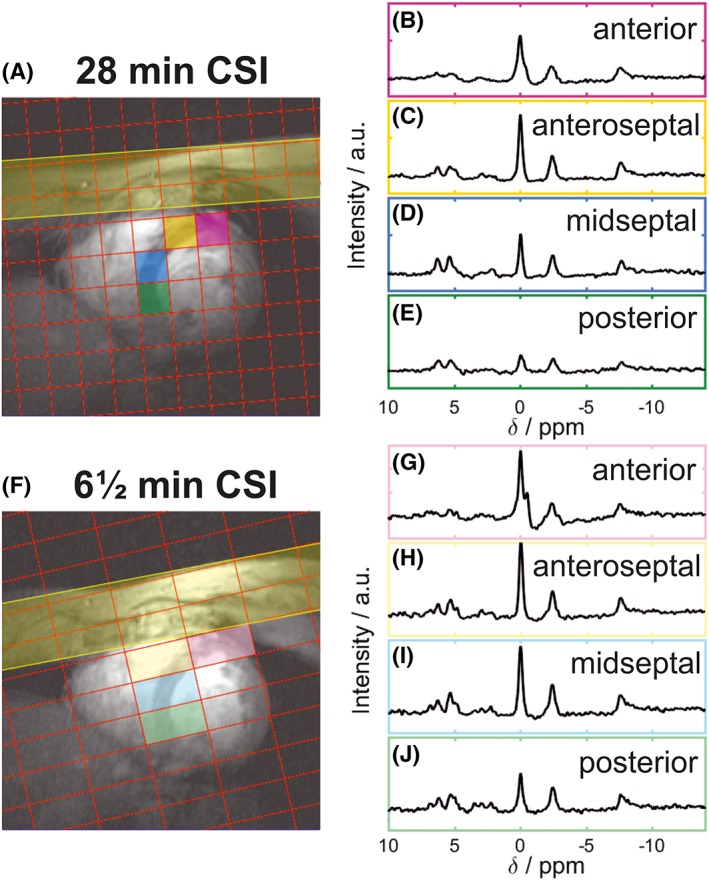
A, F, positions of the CSI matrix showing the rotation of the CSI grid in the short‐axis view of the heart for both protocols. B‐E, G‐J, spectra from the corresponding coloured voxel marked on the localizer images
Official websites use .gov
A
.gov website belongs to an official
government organization in the United States.
Secure .gov websites use HTTPS
A lock (
) or https:// means you've safely
connected to the .gov website. Share sensitive
information only on official, secure websites.
A, F, positions of the CSI matrix showing the rotation of the CSI grid in the short‐axis view of the heart for both protocols. B‐E, G‐J, spectra from the corresponding coloured voxel marked on the localizer images