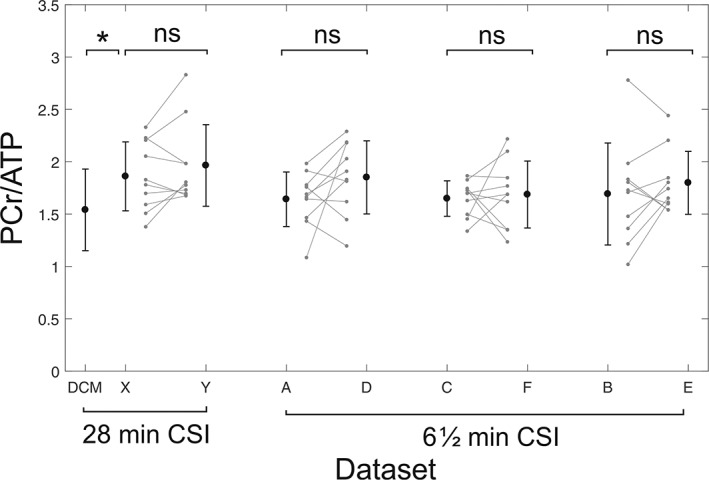
Figure 4.

Intersubject variability between scans for the 28 min CSI protocol (left) and the 6½ min CSI protocol (right). Error bars show ±1 SD. The leftmost bar shows DCM patient data acquired by Stoll et al20 using the same scanning protocol and hardware for comparison
