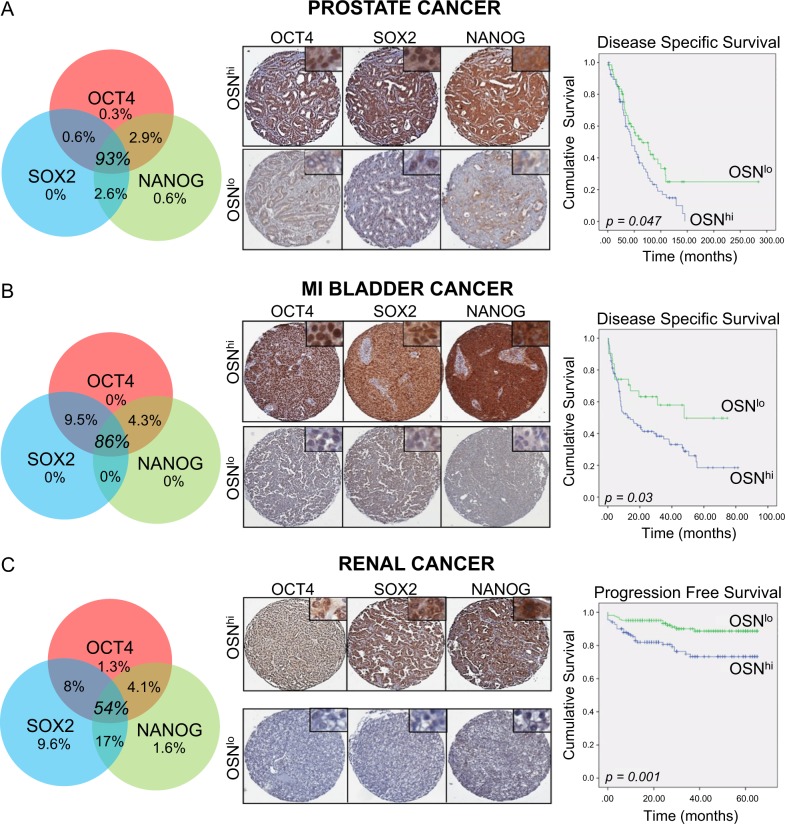
Fig. 1.
Expression of pluripotency master regulators identifies aggressive cancers and disease resistance. a Immunohistochemical analysis of tissue microarrays for prostate cancer demonstrating frequency of OCT4, SOX2 and NANOG expression (left panel), illustrative tissue cores of prostate cancer stained for OCT4, SOX2 and NANOG (OSN) representative of high (OSNhi) and low (OSNlo) levels of expression (middle panel) and correlation of OSN sum score with disease-specific survival (DSS) by Kaplan–Meier analysis (right panel). b Same as a but for muscle-invasive bladder cancer (MIBC). c Same as b but for renal cancer. Note correlation of OSN sum score with Progression Free Survival (PFS) by Kaplan–Meier analysis (right panel)

