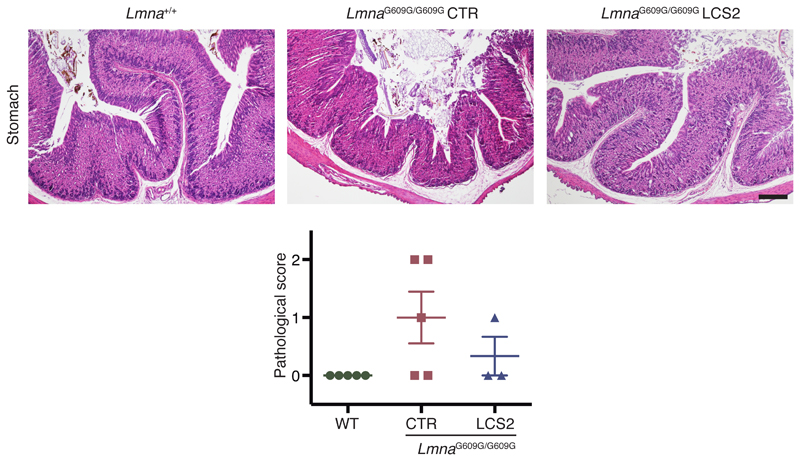
Extended Data 9. H&E staining of gastric mucosa from WT, LmnaG609G/G609G sgRNA-controltransduced and LmnaG609G/G609G sgRNA-LCS2-transduced mice.
The graph shows atrophy quantification according to a pathological score as described in Methods. Data are mean ± s.e.m. (n = 5 for WT and sgRNA-control-transduced mice; n = 3 for sgRNA-LCS2-transduced mice).

