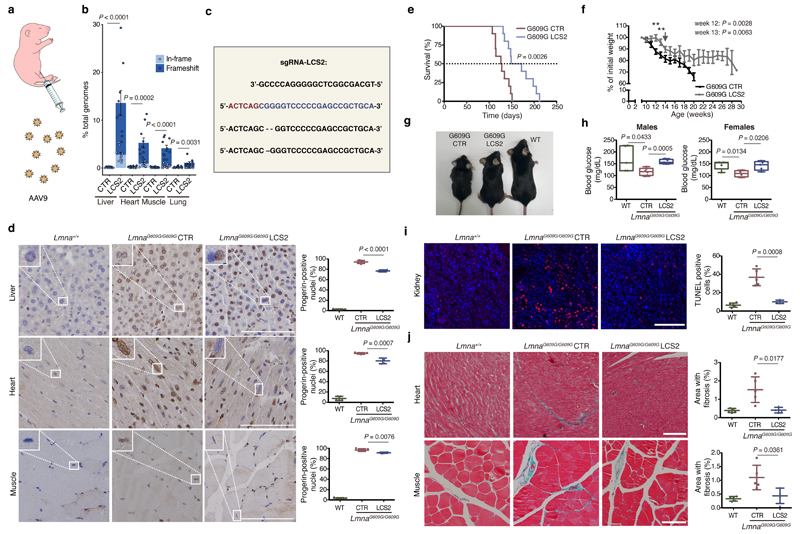
Figure 2. CRISPR/Cas9 delivery and phenotype amelioration in LmnaG609G/G609G mice.
(a) Intraperitoneal injection of AAV9 in P3 mice. (b) Percentage of in-frame and frameshift mutations at the Lmna target region in liver, heart, muscle and lung. Data are mean ± SEM (n=10 tissues per group, except n=9 sgRNA-LCS2-transduced liver; two-tailed Student’s t-test for total indels). (c) Alignment of the most common indels in sgRNA-LCS2-transduced mice. Blue, target sequence; red, PAM sequence. (d) Progerin immunohistochemistry of liver, heart and muscle from wild-type and LmnaG609G/G609G sgRNA-control-transduced or sgRNA-LCS2-transduced mice. Data are mean ± SD (n=5 wild-type and sgRNA-control-transduced mice; n=4 sgRNA-LCS2-transduced mice; two-tailed Student’s t-test). Insets, digital magnification of a selected area. (e) Kaplan-Meier survival plot of sgRNA-control- versus sgRNA-LCS2-transduced LmnaG609G/G609G mice (n=10 mice per group; two-sided Log-rank test). (f) Progression of body weight of mice transduced with sgRNA-control or sgRNA-LCS2, expressed as percentage of weight at 9 weeks. Vertical arrow, time point (3.5 months) at which the cohort destined for histological studies (4-5 mice per group) was sacrificed. Mean values ± SEM are represented (initial n=15 sgRNA-control-transduced mice; n=14 sgRNA-LCS2-transduced mice; two-tailed Student’s t-test). (g) Representative image of LmnaG609G/G609G sgRNA-control-transduced, sgRNA-LCS2-transduced and wild-type female mice at 3.5 months of age. (h) Glycemia in wild-type (males n=5; females n=5), sgRNA-control-transduced (males n=6; females n=4) and sgRNA-LCS2-transduced LmnaG609G/G609G mice (males, n=5; females, n=5). Data are represented by box plots and whiskers are minimum to maximum values (two-tailed Student’s t-test). (i) TUNEL assay in kidney of 3.5-month-old mice. Data are mean ± SD (n=5 wild-type and sgRNA-control-transduced mice; n=4 sgRNA-LCS2-transduced mice; two-tailed Student’s t-test). (j) Gomori staining in 3.5-month-old mouse tissues showing moderate perivascular and interstitial fibrosis in heart and quadriceps muscle of LmnaG609G/G609G mice (blue areas). Data are mean ± SD (n=5 wild-type and sgRNA-control-transduced mice; n=4 sgRNA-LCS2-transduced mice; two-tailed Student’s t-test). Scale bars, 100 μm (d, i, j).

