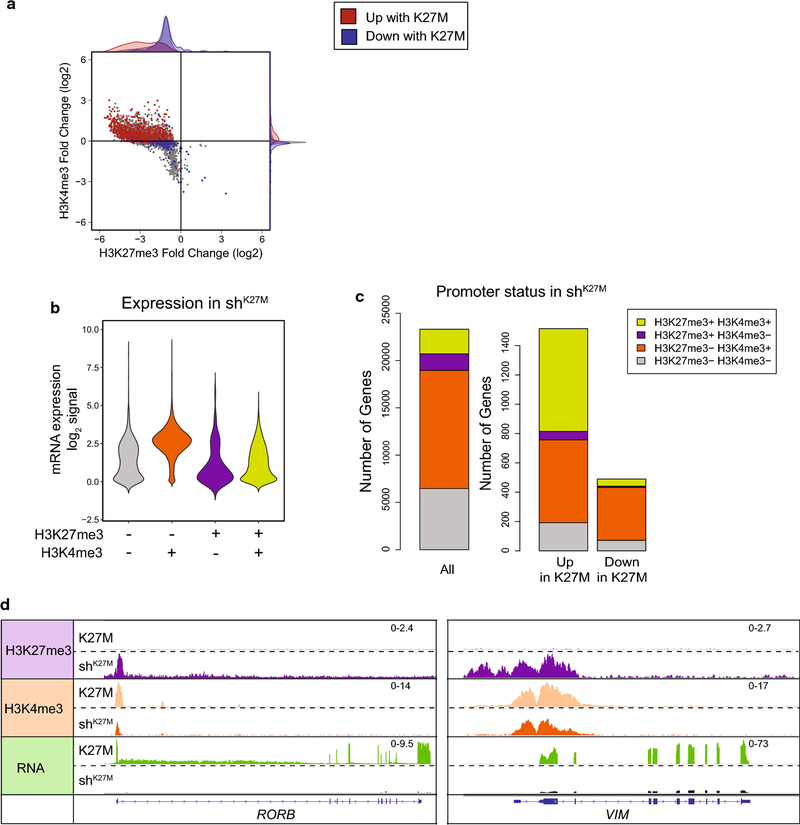
Figure 6. Combinatorial analysis of histone PTMs suggests that H3.3 K27M-induced genes are enriched for apparently bivalent promoters.
a. Fold change (FC) in ChIP-seq signal in SJDIPGX37 transduced with non-silencing (K27M) vs. H3F3A shRNA (shK27M) in 2kb surrounding TSS for H3K27me3 vs. H3K4me3. Colored dots represent promoters with differential gene expression FC>1.5 (red) or <−1.5 (blue) and an adjusted p-value<0.05. Marginal histograms display density, but are not quantitative between groups. b,c. Promoters binned by the presence or absence of MACS called H3K27me3 and H3K4me3 peaks inside the 2kb surrounding the TSS in shK27M SJDIPGX37 tumors. b. Violin plot showing log2 RPKM expression in the shK27M tumors for all genes binned by promoter type. Lime green represents promoters marked with H3K27me3 and H3K4me3 consistent with bivalency. c. Left bar graph shows H3K27me3 and H3K4me3 promoter status for all genes in shK27M tumors, while the bar graphs on the right show promoter status in shK27M tumors for genes that are differentially regulated (|FC|>1.5, adjusted p-value<0.05). d. IGV tracks showing representative loci scored as H3K27me3+H3K4me3+ (left tracks, RORB, right tracks, VIM) in shK27M tumors. Scale for pairs of tracks shown at right. See also Suppl. Fig. 5 (Online Resource 2)].

