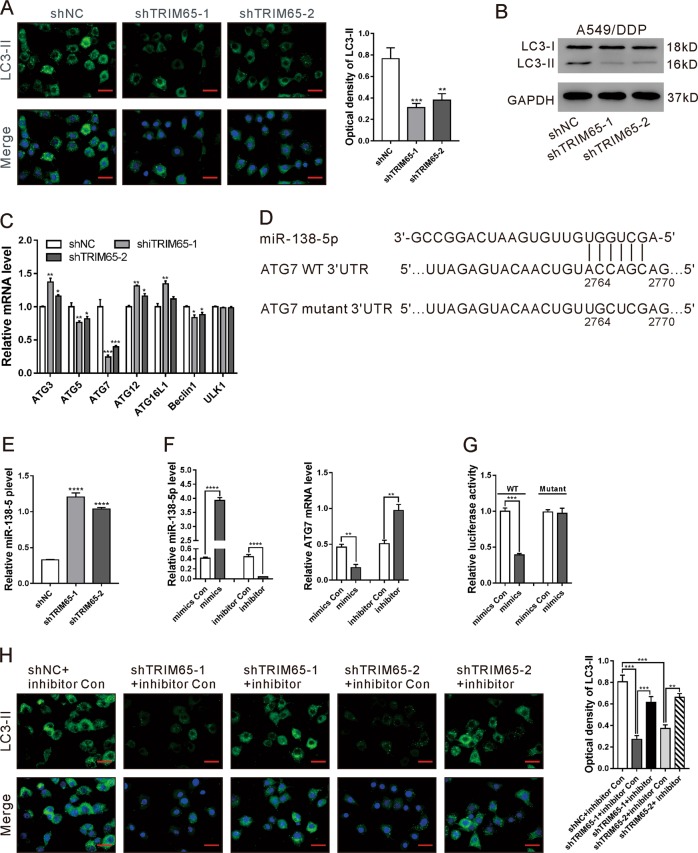
Fig. 2. TRIM65 knockdown inhibited autophagy via an miRNA signaling pathway.
a Immunofluorescence staining of LC3-II in A549/DDP cells transduced with shTRIM65–1, shTRIM65–2, or shNC. Scale bar: 20 μm. **P < 0.01, ***P < 0.001 versus shNC. b Western blotting analysis of LC3-II/LC3-I in A549/DDP cells transduced with shTRIM65–1, shTRIM65–2 or shNC. (c) mRNA expression of autophagy-related proteins in A549/DDP cells transduced with shTRIM65–1 or shNC. *P < 0.05, **P < 0.01, ***P < 0.001 versus shNC. d The potential target sites of miR-138-5p in 3′UTR of the ATG7 gene. e The levels of miR-138–5p in A549/DDP cells transduced with shTRIM65–1, shTRIM65–2 or shNC. ****P < 0.0001 versus Vector. f A549/DDP cells were treated with miR-138–5p mimics, mimics control (Con), miR-138-5p inhibitor or inhibitor Con for 48 h. The levels of miR-138-5p (left) and ATG7 mRNA (right) were determined by real-time PCR. **P < 0.01, ***P < 0.001. g Luciferase reporter assays were performed in A549/DDP cells transfected with miR-138-5p mimics/mimics control and ATG7 3′UTR. WT and Mutant indicate the wild-type and mutated sequences of ATG7 3′UTR, respectively. ***P < 0.001. h A549 cells treated with Vector + mimics Con, TRIM65OE + mimics Con, or TRIM65OE + mimics for 48 h. Immunofluorescence staining of LC3-II was performed. Scale bar: 20 μm. **P < 0.01, ***P < 0.001

