Fig. 3.
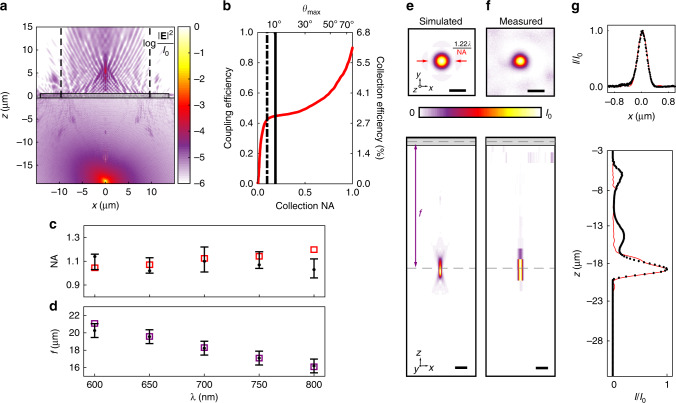
Metalens performance. a Simulated steady-state field intensity produced by the two optical dipoles of an NV center (with [111] orientation) placed at the metalens focus at λ = 700 nm. The position of the metalens is indicated by the gray box. Dashed black lines indicate the 19.3-μm effective aperture of the metalens. b Coupling efficiency and overall collection efficiency as a function of the acceptance angle of the collection optics placed after the metalens, calculated from the simulations shown in a. The dashed and solid lines indicate NA values 0.1 and 0.19, corresponding to the NA of the optical fiber and collimating lens used in the measurements, respectively. c Measurement (black points) and simulation (open red squares) of the metalens NA as a function of wavelength. Error bars represent the uncertainty in the objective NA, as described in the Methods section. d Measured (black points) and simulated (open purple squares) effective focal length. Error bars represent the uncertainty in estimating the positions of the focal spot and diamond surface. e, f Transverse (x–y, top) and axial (x–z, bottom) cross-sections of the metalens focal spot at λ = 700 nm: e simulated using a 3D finite-difference time-domain (FDTD) method, and f measured using a confocal scanning optical microscope with the microscope’s point-spread function deconvolved. Gray boxes and dashed lines in axial cross-sections indicate the thickness of the metalens pillars and focus position, respectively. Scale bars denote 500 nm in transverse plots and 1 μm in axial cross-sections. g x (top) and z (bottom) line scans of the simulated (solid red curves) and measured (points) metalens focus at λ = 700 nm

