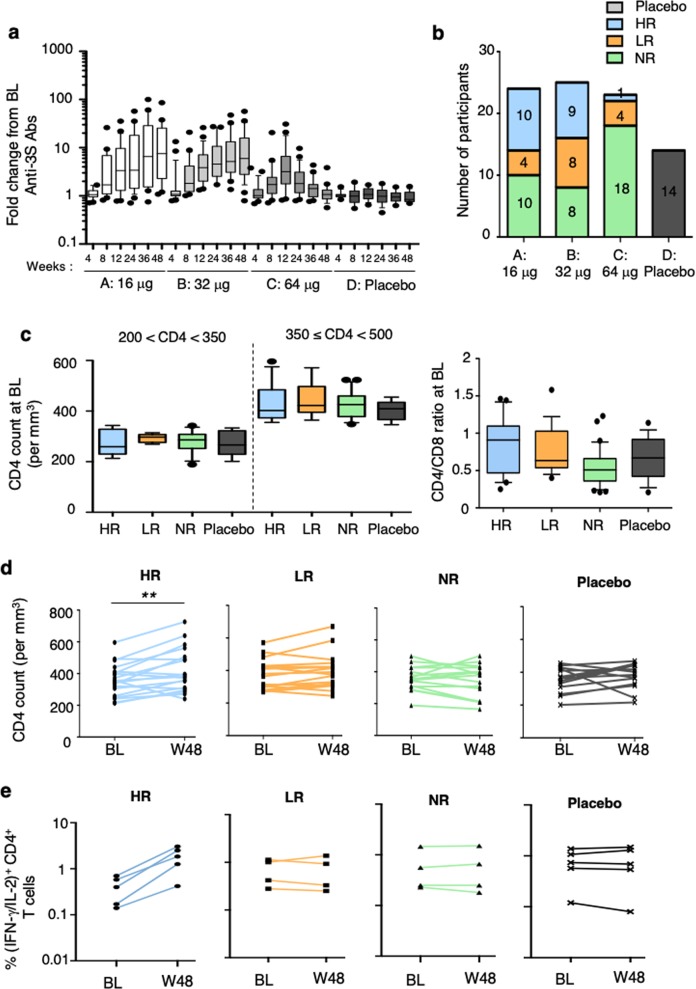
Fig. 3.
Immunogenicity and CD4 counts over time in patients vaccinated with VAC-3S. Fold changes from baseline (BL) of anti-3S Ab levels in serum samples from patients at different time points (week 4–week 48) in the four study arms: A 16 μg, B 32 μg, C 64 µg of VAC-3S vaccine, and D placebo in a. Classification of subjects as high (HR, ≥ 10-fold change), low (LR, > 4-fold change), and non-responders (NR, ≤4-fold change) in terms of their anti-3S response at week 48 compared to baseline (BL) in b. CD4 counts in patients with 350 < CD4 < 500 cells and CD4/CD8 ratios at baseline in high (HR), low (LR), and non-responders (NR), compared to placebo in c. D Course of CD4 count per mm3 between baseline (BL) and week 48 (W48) in high (HR), low (LR), and non-responders (NR), and placebo patients in d. **p < 0.001 (Wilcoxon matched-pairs test). Frequency of CD4+ T cells expressing IFN-γ and/or IL-2 following PPD stimulation is shown in e. CD4+ T cell responses were assessed after peripheral blood mononuclear cells (PBMC) stimulation with PPD (10 μg/mL) at baseline (BL) and week 48 (W48) in high (HR, n = 5), low (LR, n = 4), and non-responders (NR, n = 4), compared to placebo (n = 5). All values have been corrected for isotype controls and production in the absence of recall Ag. Control cells stimulated with Staphylococcus enterotoxin B (2 μg/mL; positive control) or media alone (negative control) are not shown

