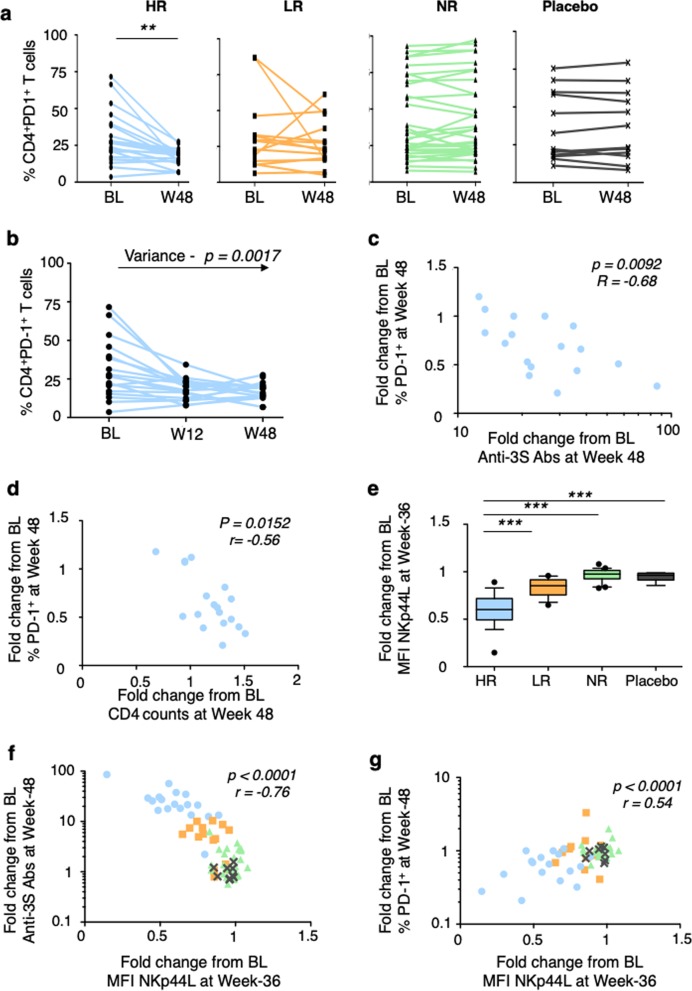
Fig. 4.
Immunomodulation in patients vaccinated with VAC-3S Course of PD-1 frequency on CD4+ T cells between baseline (BL) and week 48 (W48) in high (HR), low (LR), and non-responders (NR), and placebo patients in a. **p < 0·001 (Wilcoxon matched-pairs test). Kinetics of PD-1 expression on CD4+ T cells from baseline (BL) to week 12 (W12) to W48 in each high responder (HR). Significant values of the variance are indicated in b. Correlation of changes from baseline (BL) to week 48 in high responders between the frequency of PD-1 expression on CD4+ T cells and anti-3S production in c, and the CD4 count in d. Fold changes from baseline (BL) to week 36 of NKp44L expression, expressed in mean of fluorescence intensity (MFI) on CD4+ T cells treated by serum samples from high (HR), low (LR), and non-responders (NR), compared to placebo in e. ***p < 0·0001 (Mann–Whitney test). Correlation of fold changes from baseline (BL) between NKp44L expression and anti-3S production. High responders (blue circles), low responders (orange squares), non-responders (green triangles), and placebo (grey cross) in f. Correlation was evaluated with a Spearman rank correlation coefficient test. Correlation of changes from baseline (BL) between NKp44L expression and the frequency of PD-1 expression on CD4+ T cells in g. High responders (blue circles), low responders (orange squares), non-responders (green triangles), and placebo (grey cross). Correlation was evaluated with a Spearman rank correlation coefficient test

