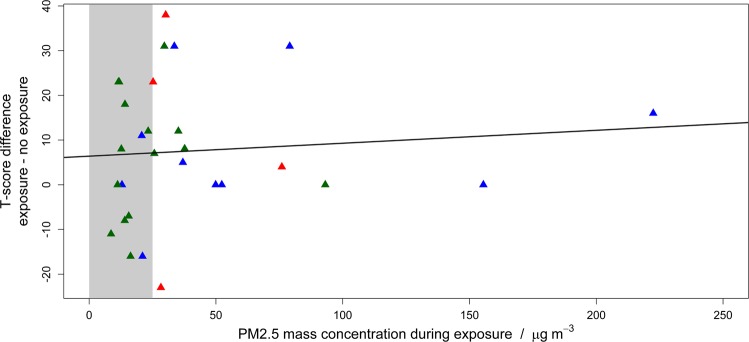
Figure 2.
Comparison between MMSE T-score difference and PM2.5 mass concentration during exposure for the candle burning experiment. The difference values compare the post-exposure minus the pre-exposure values. Symbols represent type of candle: red – beeswax, blue – paraffin, green – stearin. The line represents the linear regression of the data points. Grey shaded area represents mass PM2.5 mass concentrations less than 25 µg m−3.

