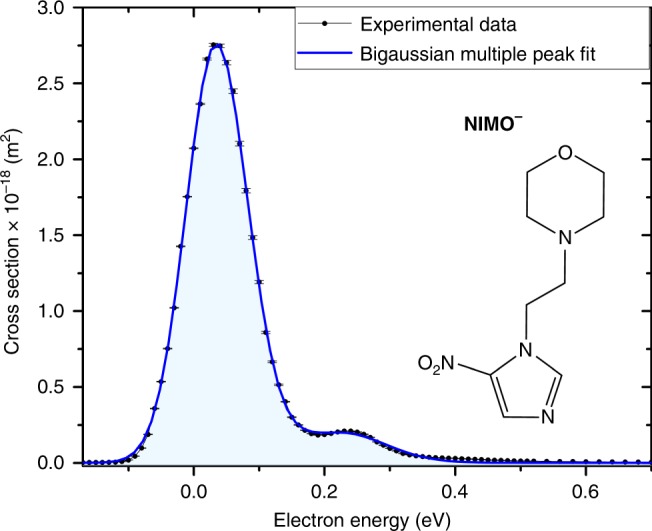
Fig. 1.

Cross-section of the nimorazole radical anion and molecular composition. The black dots (connected by the black line as guide for the eye) represent the experimentally determined cross-section values as a function of the electron kinetic energy. Statistical error margins are included for each data point and refer to the standard error of the mean, see data analysis section for details. The blue line shows a bigaussian (sum of two Gauss peaks) multiple peak fit of the experimental data. In addition, the skeletal formula of nimorazole (C9H14N4O3) with its nitroimidazole moiety and the morpholine ring is shown. Source data are provided as a Source Data file
