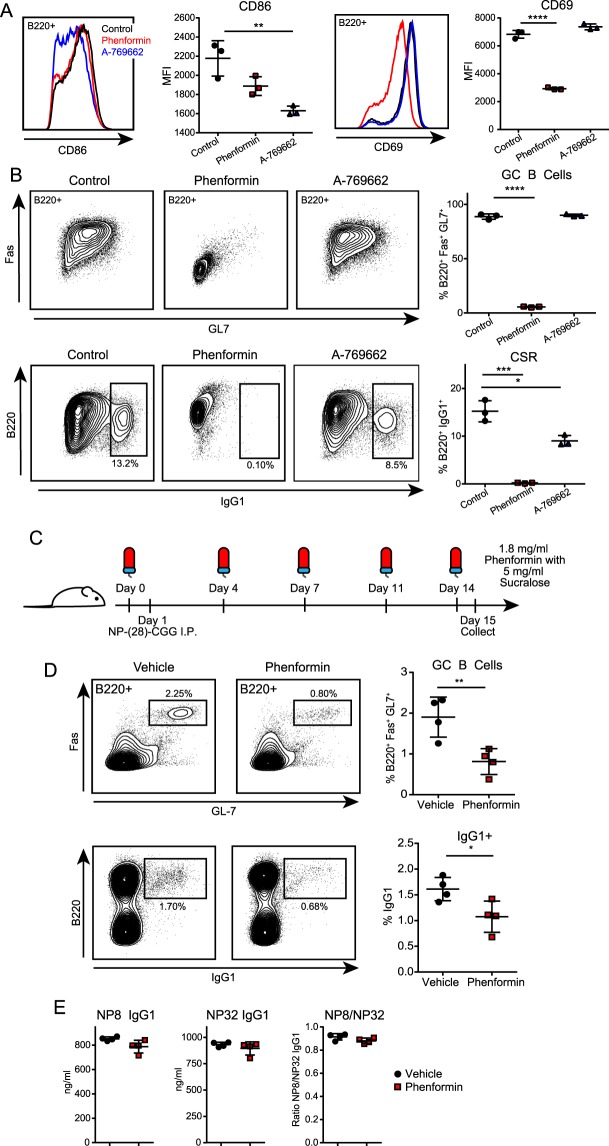
Figure 6.
Early pharmacological activation of Ampk modifies B cell function both in vitro and in vivo. (A,B) Representative flow cytometry plots and quantification of activation markers (CD86, CD69) at 24 hours (A), and germinal center differentiation (GC B Cells, %B220+ Fas+ GL7+) and class switch recombination (CSR, %B220+ IgG1+) at day 3 (B) of cells during in vitro activation with anti-CD40 plus IL-4 and phenformin (100 µM) or A-769662 (50 µM) (n = 3). (C) Strategy for in vivo assessment of B cells responses with Ampk activation. Prior to immunization, mice were given phenformin or vehicle (sucralose) in their water. Water was changed 2×/week, and samples collected 14 days post immunization with NP-(28)-CGG. (D) Flow cytometry of total splenocytes after immunization. Representative plots and quantification of GC differentiation (GC B Cells, B220+ Fas+ GL7+) and CSR (B220+ IgG1+) 14 days post-immunization with NP-(28)-CGG (n = 4). (E) Anti-NP8 and anti-NP32 IgG1 serum response and NP8/NP32 IgG1 ratio by ELISA 14 days after immunization with NP-(28)-CGG (n = 4). Data represent mean ± SD. P values determined by 2-way ANOVA with Bonferroni correction for multiple comparisons (A,B), or Student’s t-test (D,E), *P ≤ 0.05, **P ≤ 0.01, ***P ≤ 0.001, ****P ≤ 0.0001.

